
Fig. 5.
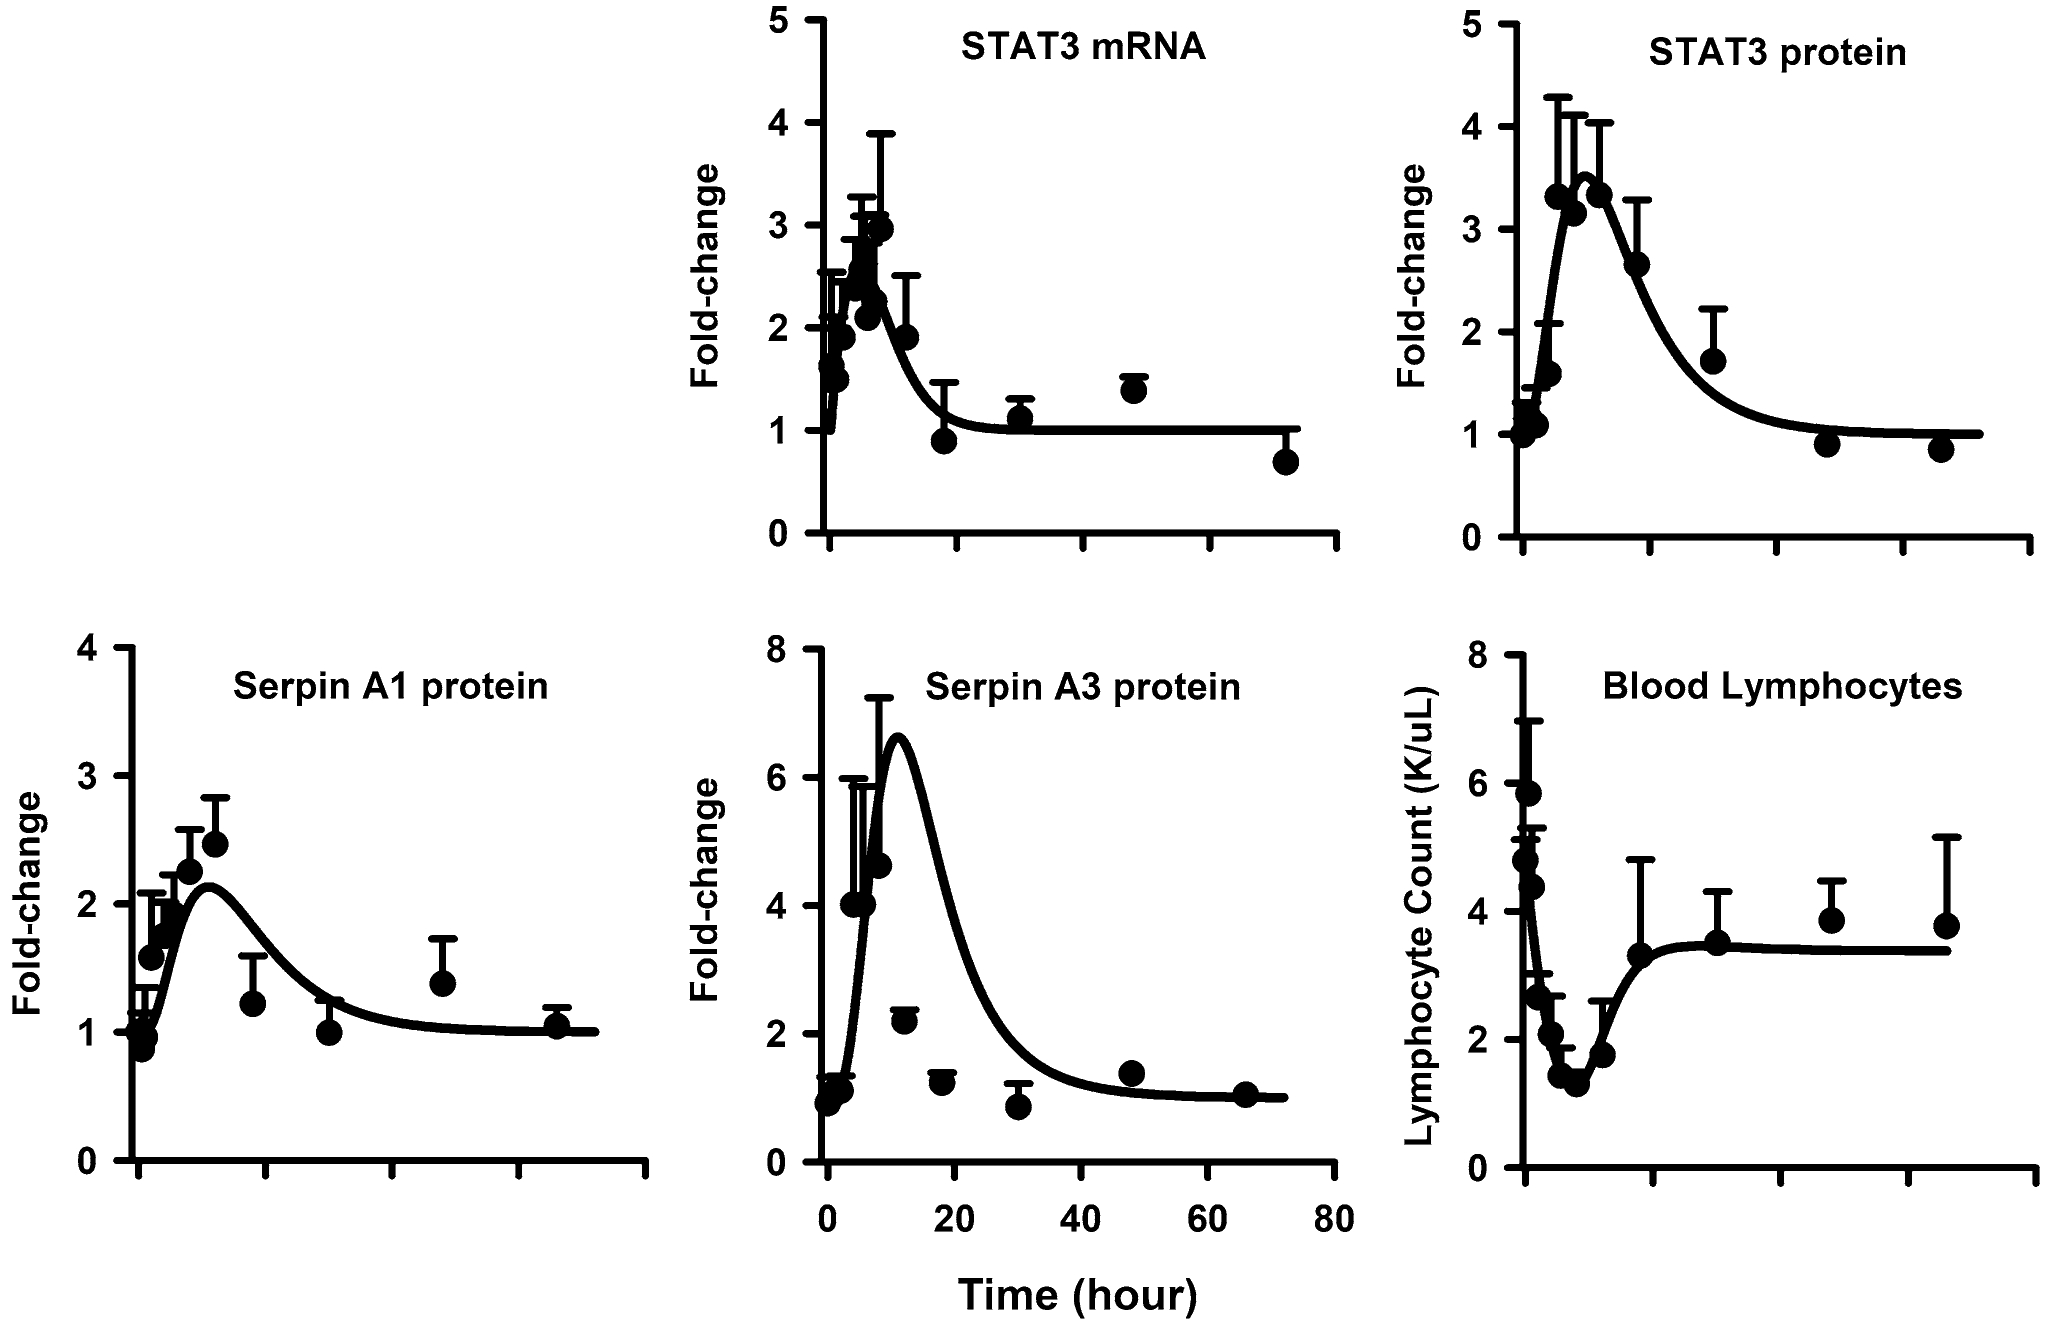
Hepatic STAT3 mRNA (top left panel), STAT3 protein (top right panel), Serpin A1 protein (middle left panel), Serpin A3n (middle right panel), and blood lymphocyte (bottom left panel) dynamics after 50 mg/kg MPL. The circles and bars are means + 1 SD and solid lines depict model (Fig. 1) fitting results based on the parameters shown in Tables 1 and 4