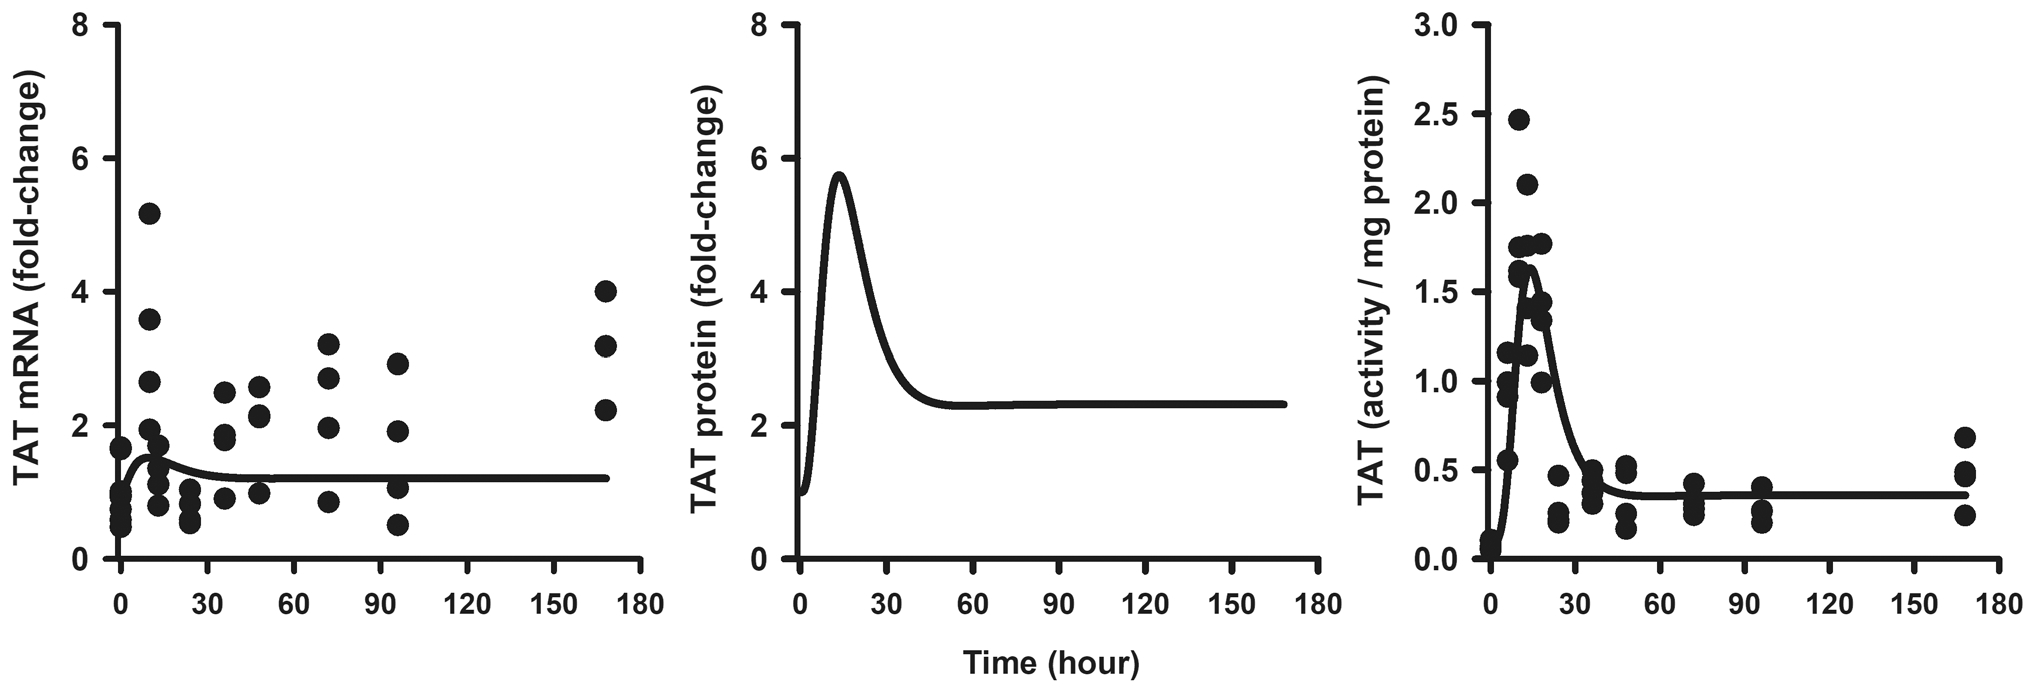
Fig. 6.

Hepatic TAT mRNA (left panel), TAT protein (center panel), and TAT activity (right panel) dynamics during a 0.3 mg/kg/h SC infusion of MPL for 7 days. Each circle is an individual measurement from one rat and solid lines depict simulated predictions performed based on the developed model (Fig. 1) using parameters shown in Tables 1 and 2. Data were from a previous report. Reproduced with Permission from Ramakrishnan et al. [35]
