
Fig. 7.
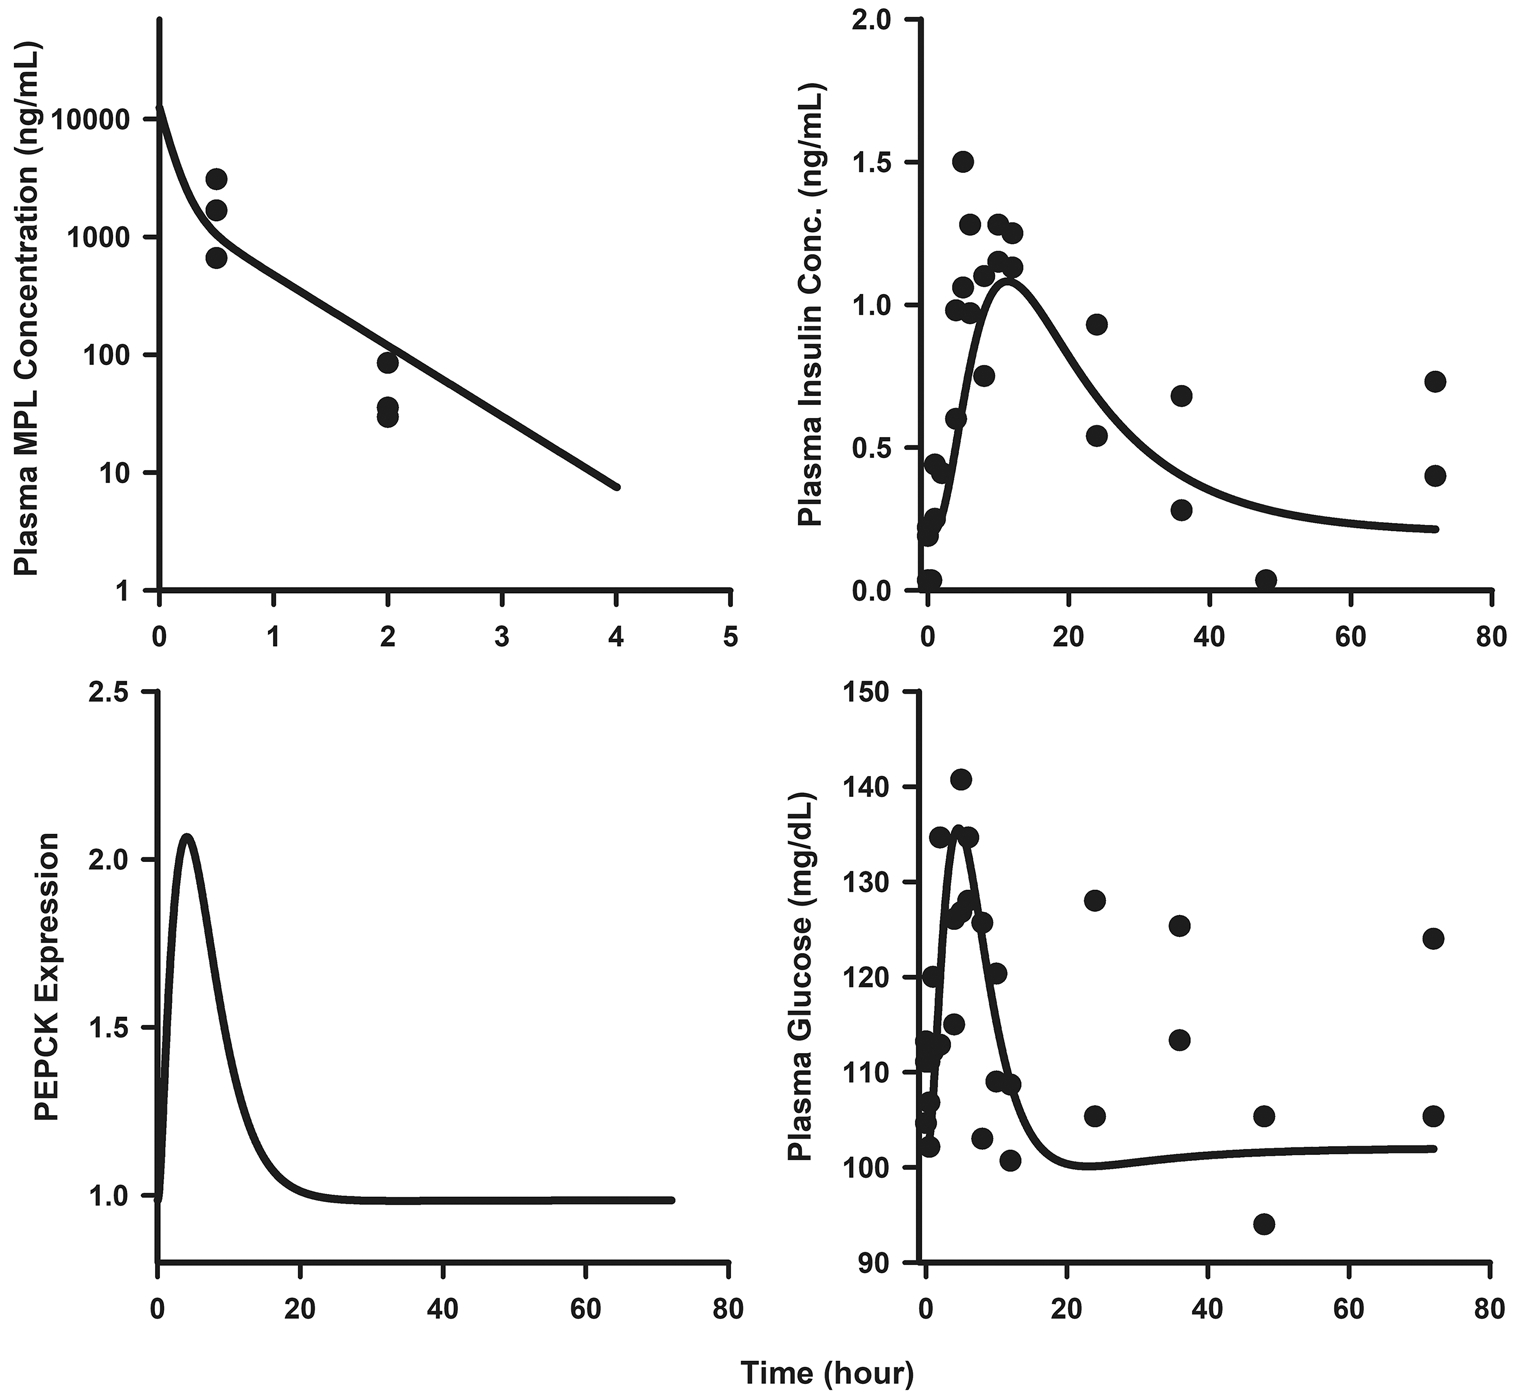
Plasma PK of MPL (top left panel), plasma insulin (top right panel), hepatic PEPCK protein (bottom left panel), and plasma glucose (bottom right panel) dynamics following a 10 mg/kg IV bolus of MPL. Circles are measurement from single rats and solid lines depict simulated predictions performed based on the developed model (Fig. 1) using parameters shown in Tables 1 and 3. Data were from a previous report. Reproduced with Permission from Jin and Jusko [23]