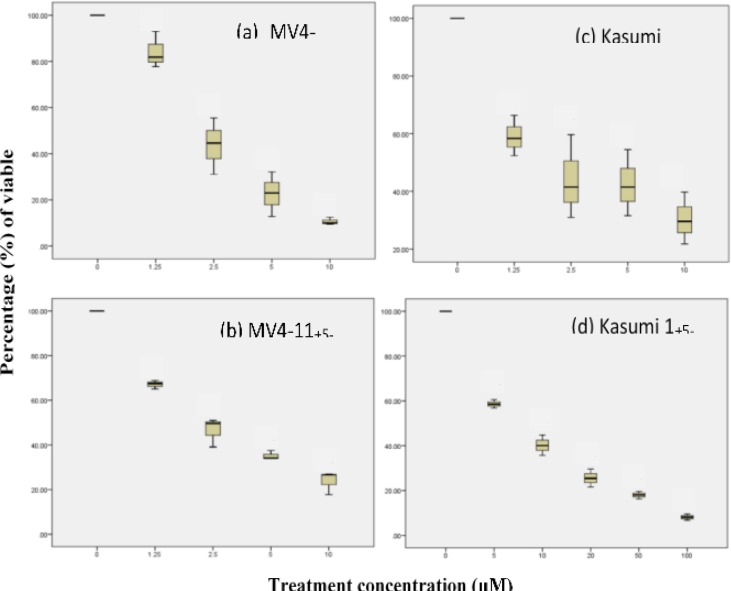
Figure 1.
Effect of TSA and 5-Aza treatment on cell viability by percentage (%) inhibition of MV4-11 and Kasumi 1 cell lines relative to non-treated cell lines. Significant inhibition of MV4-11 after (a) TSA and (b) 5-Aza treatment at increasing concentration (0.0, 1.25, 2.5, 5.0 and 10.0 µM) for 24 h. Significant inhibition of Kasumi 1 after (c) TSA treatment at increasing concentration (0.0, 1.25, 2.5, 5.0 and 10.0 µM) and (d) 5-Aza (0.0, 5.0, 10.0, 20.0, 50.0 and 100.0 µM) for 24 h calculated by Trypan Blue Exclusion Assay (TBEA) (One-Way ANOVA, LSD multiple comparison, p<0.05).

