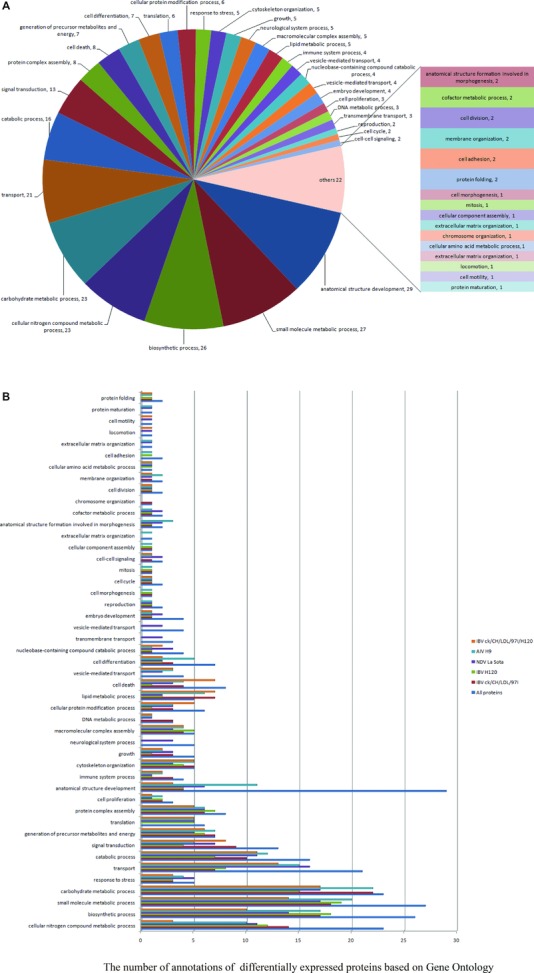
Figure 4.

GO annotation analyses of differentially expressed proteins according to their biological process categories. This classification was produced by using the GOSlimViewer tool of the Agbase database (http://www.agbase.msstate.edu/). (A) Biological process classification of all identified proteins. (B) Comparison of biological process classification of differentially expressed proteins in IBV ck/CH/LDL/97I, H120, NDV La Sota, and AIV H9 infected groups and between IBV ck/CH/LDL/97I and H120‐infected groups.
