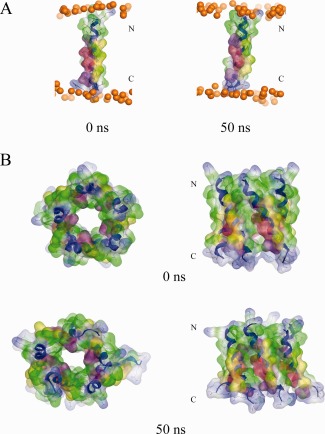
Figure 1.

The single transmembrane domain (TMD) 8a1–22 is shown at the beginning (0 ns) and end of a 50 ns MD simulation (A). Top view (left) and side view (right) of a pentameric bundle of 8a1–22 at the beginning (upper) and end of 50 ns MD simulation (lower) (B). The protein backbones are drawn in blue with the side chains shown in stick modus and van der Waals surface representation (MOE). Residues Thr‐8, Ser‐11, and −14 are shown in pink and light red, respectively. All cysteine residues, Cys‐9, −13, and −17, are shown in yellow. Phosphorous atoms of the lipids are shown in orange spheres. Lipid and water molecules are omitted for clarity. [Color figure can be viewed in the online issue, which is available at http://wileyonlinelibrary.com.]
