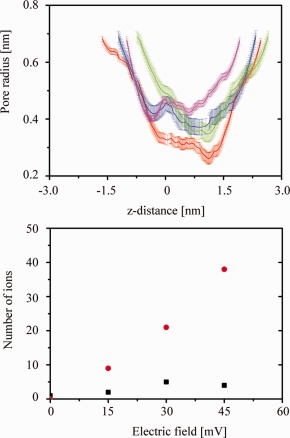
Figure 3.

Upper panel: Calculations of the pore radii of the bundles at different voltages: 0 mV (red (from structure at 50 ns) lines), 15 mV (blue line), 30 mV (green line), and 45 mV (pink line). The error bars derive from calculations of the pore radii from three different time frames within the first and the respective last nanosecond of the simulations. Lower panel: Calculated numbers of ions passing through the pore at various voltages. Black squares represent the Na‐ions, red circles represent the Cl‐ions. [Color figure can be viewed in the online issue, which is available at http://wileyonlinelibrary.com.]
