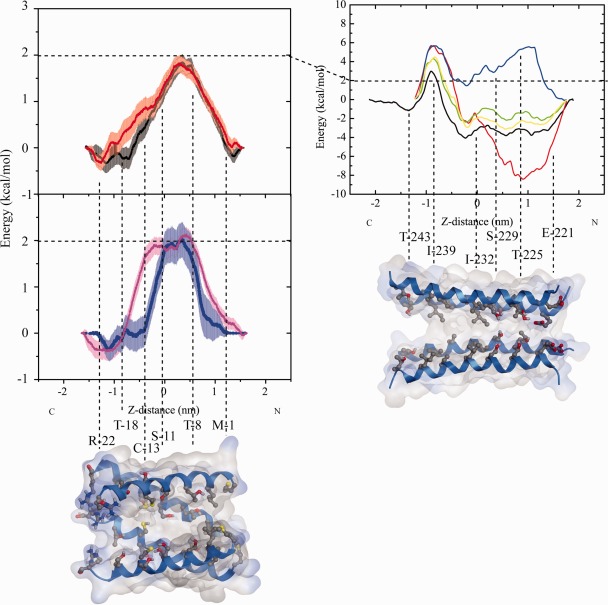
Figure 4.

Calculation of the potential of mean force (PMF) for ions passing through the bundle of 8a (left graph) and a bundle model of the M2 helices (right graph) taken from the (GLIC, PDB entry code: 3EHZ). The estimated error calculated for each of the data points is based on a bootstrap analysis (n = 50) and shown as error bars. The color code for the ions passing through the 8a‐bundle is as following: Na‐ions (black, upper graph), K‐ion (red, upper graph), Ca‐ion (blue, lower graph), and Cl‐ion (pink, lower graph). The color code for ions passing through the M2 helices is: Cl‐ion (blue), Ca‐ion (red), two simulations for Na‐ion (yellow and green), and K‐ion (black). The color code for the structure motif and the atoms in the bundles is as following: helices in blue, oxygen in red, nitrogen in blue, sulfur in yellow, all other types of atoms in gray.
