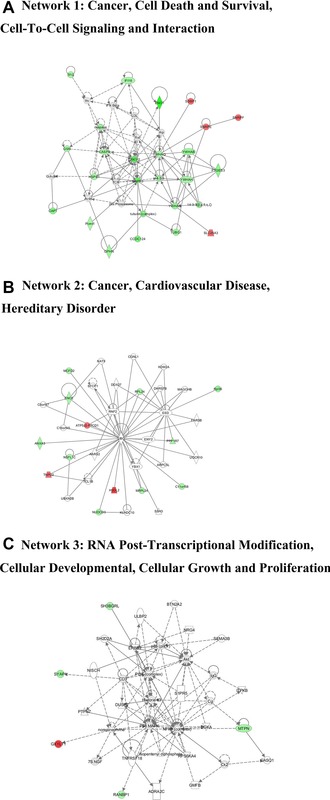
Figure 3.

Specific network analysis of proteins significantly altered in PEDV‐infected cells. Significantly upregulated proteins are shown in red, significantly downregulated proteins in green, and proteins that were not identified in this study but are involved in the networks are shown in white. The color shade indicates the magnitude of the change in protein expression. Shapes are indicative of the molecular class, and lines with arrows indicate molecular relationships (Supporting Information Fig. 1).
