
Figure 3.
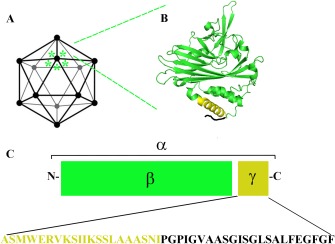
Schematic representation of FHV capsid (A). An expanded view of the crystallographic structure (pdb: 4FTB) of one subunit (α protein) showing the location of the amphipathic region of γ peptide in yellow (B). Schematic representation of α protein, which undergoes auto cleavage during maturation producing β and γ (C) with relative sequence of γ peptide