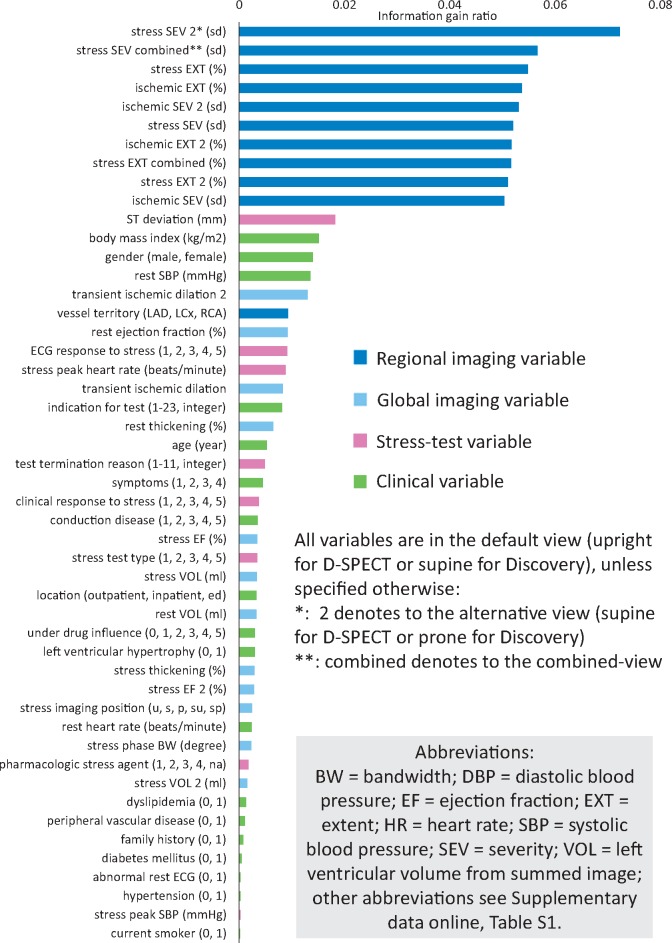
Figure 1.
Selected variables ranking by IGR. The ML algorithm evaluated all 55 used variables independently to determine the IGR for each variable in each fold. Forty-nine out of 55 variables had IGR >0 and were selected. ML models were built with these selected variables. Most variables in the ranking are imaging variables (blue and light blue bars) with regional imaging variables (blue bars) leading while clinical and stress-test variables also play roles in the prediction. IGR, information gain ratio; ML, machine learning.

