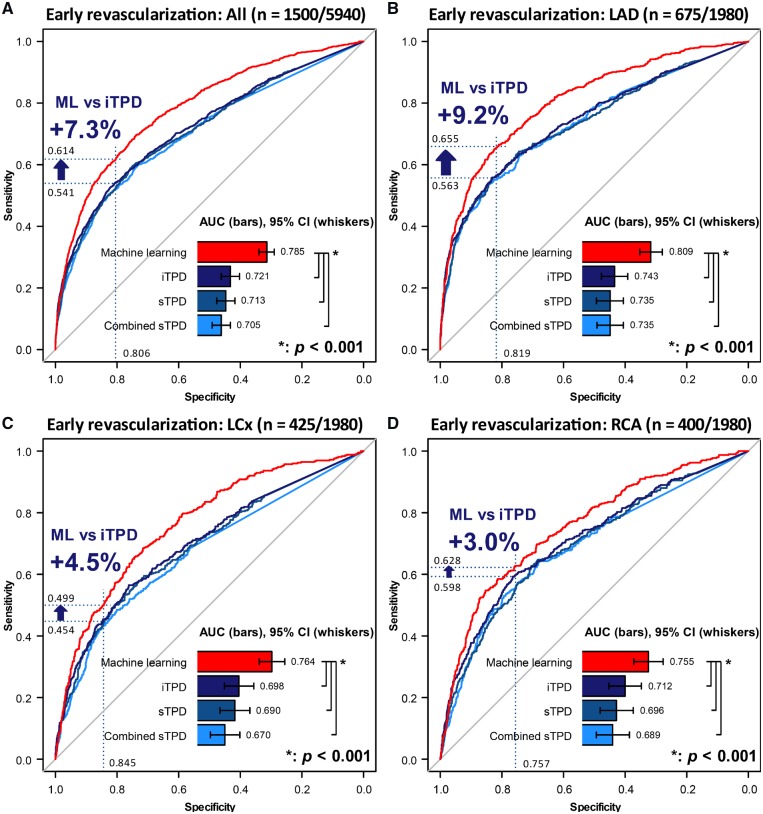
Figure 3.
Paired ROC curves for the prediction of early revascularization: per-vessel result. Per-vessel results of predictions in all three coronaries (A), LAD (B), LCx (C), and RCA (D) territories. When operating with the same specificity of 80.6% using a cut-off of iTPD of 3%, ML shows a 7.3% improvement of sensitivity in the result of all three territories (A), and the improvement in each territory is also shown in (B–D) (blue arrows). The somewhat lower performance for RCA revascularization prediction might have been due to more common attenuation artefacts in that territory.29 AUC, area under the ROC curve; CI, confidence interval; combined sTPD, regional combined-view stress TPD; iTPD, regional ischaemic TPD; LAD, left anterior descending artery; LCx, left circumflex artery; ML, machine learning; RCA, right coronary artery; ROC, receiver-operating characteristic curve.

