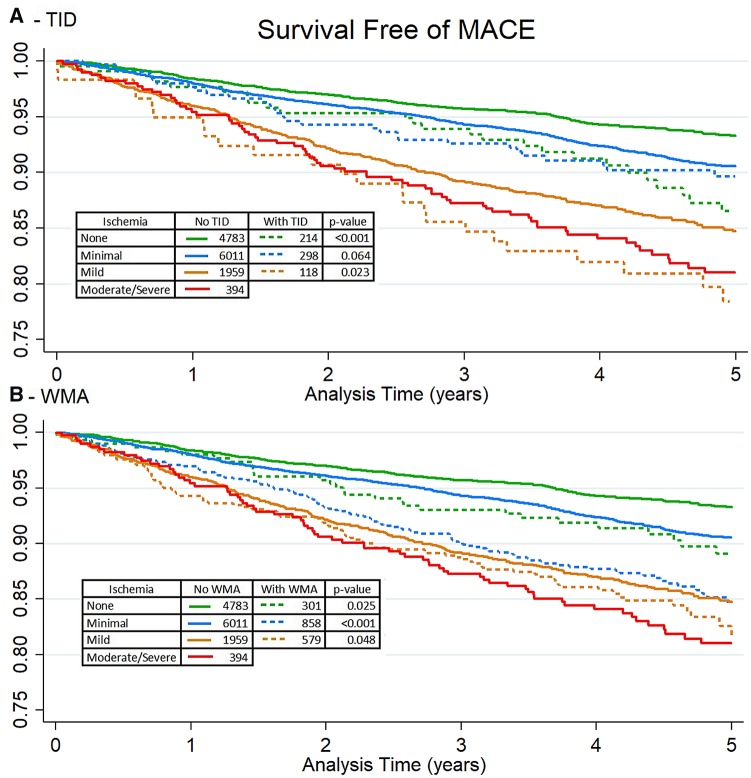
Figure 1.
Kaplan–Meier survival estimates stratified by extent of ischaemia and presence of TID (A) and post-stress WMA (B). Tables contain number of patients at risk at baseline and log-rank P-value comparing survival curves. No ischaemia (<1% ischaemic TPD), minimal ischaemia (1 to <5% ischaemic TPD), mild (5 to <10% ischaemic TPD), moderate/severe (≥10% ischaemic TPD). Patients with reduced LVEF were excluded. TID, transient ischaemic dilation; WMA, wall motion abnormality.

