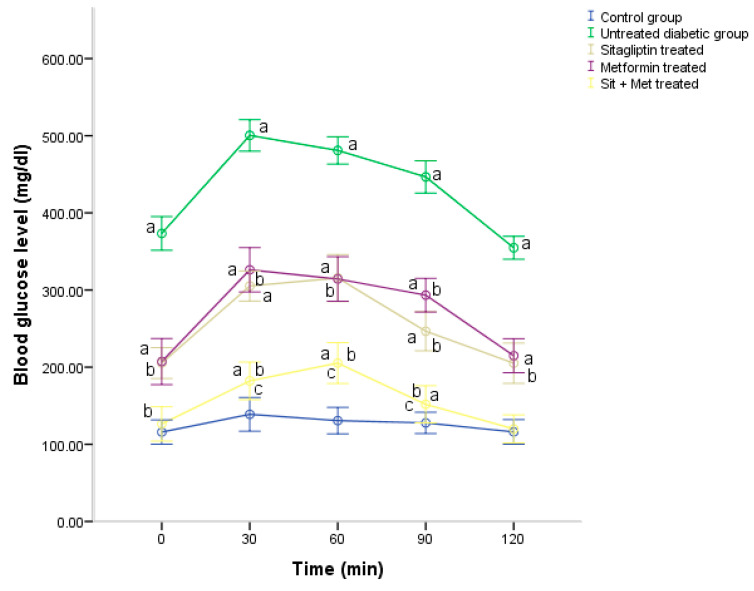
Figure 3.
Changes in the blood glucose level (mg/dL) during the conduction of OGTT (oral glucose tolerance test) in the experimental groups at the end of the treatment period. The data were expressed as a mean ± SD (n = 10). a: significantly different, compared to the control group. b: significantly different, compared to the untreated diabetic group. c: significantly different, compared to the sitagliptin and metformin-treated groups, using post hoc ANOVA (LSD), p < 0.05.

