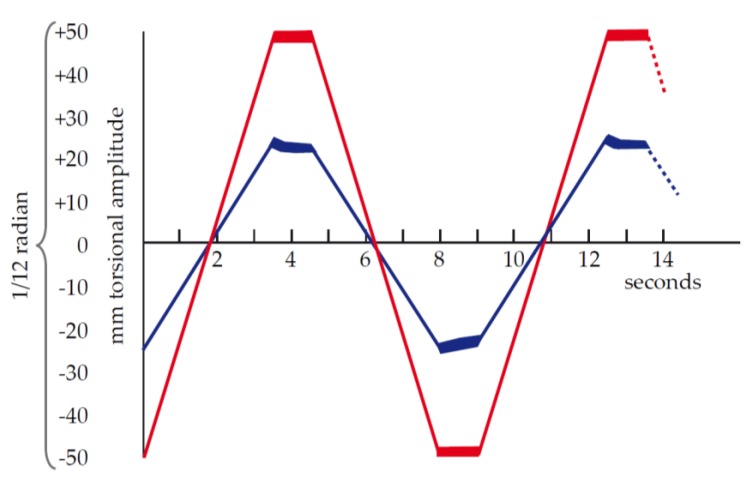
Figure 4.
Chart representing the movement of Dr. Hartert’s cup and pin after clotting of the blood sample. The red line represents the displacement of the cup and the blue line represents the displacement of the pin. The units on the x-axis represent the extent of the illuminated section of film by the rotating mirror. The units of mm amplitude on the y-axis remain today in many viscoelastic hemostatic assay systems. The units of mm to express a clot strength has been the source of confusion in this space. Reproduced with permission from [4].

