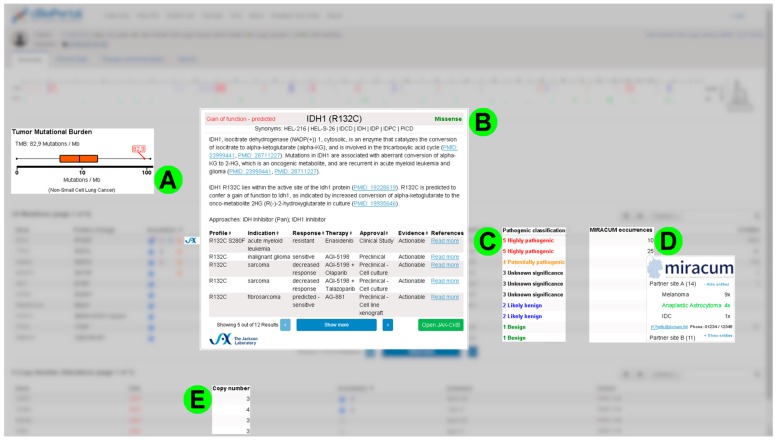
Figure 2.
Collage demonstrating some requirements for the case analysis. This collage is a synthesis of different screenshot mockups, which exemplarily illustrates some requirements for individual case analysis: (A) A visual representation of the tumor mutational burden relative to the expected range of the corresponding tumor entity using a box plot. (B) Integration of data from the JAX Clinical Knowledgebase (JAX-CKB) via annotation and pop-up. (C) Classification of pathogenicity as an example of data extension in the mutation table of the patient view. (D) Tool for an entity-specific display of how often a certain mutation was found and classified as relevant for the therapy recommendation at the partner sites. If necessary, the contact data may be used to exchange experiences. (E) Extension of the table with copy number variation (CNV) data by the exact number of copies. Example data adopted from the public cBioPortal (https://cbioportal.org) and JAX-CKB knowledgebase [20].

