
Figure 1.
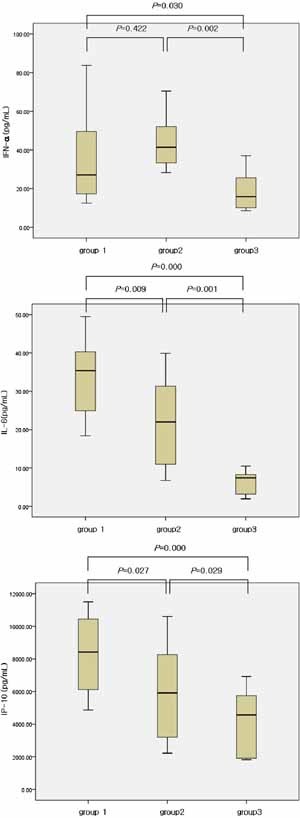
Levels of cytokines (IFN‐α, IL‐6, IP‐10) in the three groups. Median, quartiles, and range are shown. The Mann–Whitney test was used to compare cytokine levels.
Official websites use .gov
A
.gov website belongs to an official
government organization in the United States.
Secure .gov websites use HTTPS
A lock (
) or https:// means you've safely
connected to the .gov website. Share sensitive
information only on official, secure websites.
Levels of cytokines (IFN‐α, IL‐6, IP‐10) in the three groups. Median, quartiles, and range are shown. The Mann–Whitney test was used to compare cytokine levels.