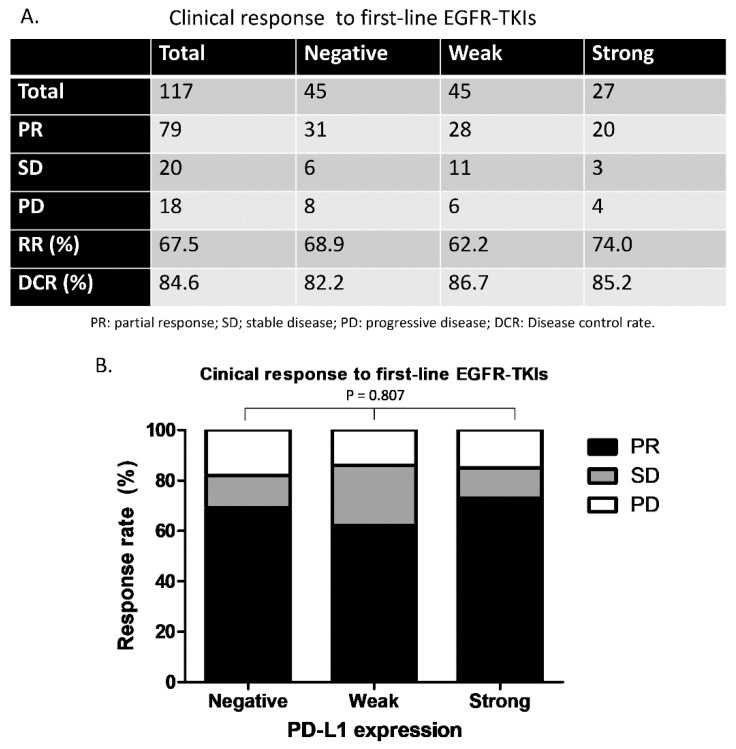
Figure 3.
Clinical response to first-line EGFR-TKIs in this study. (A) Overall response rate and disease control rate for the three groups of patients. (B) Comparison of the response rate between the three groups of patients (p = 0.807). PR, partial response; SD, stable disease; PD, progressive disease; DCR, disease control rate.

