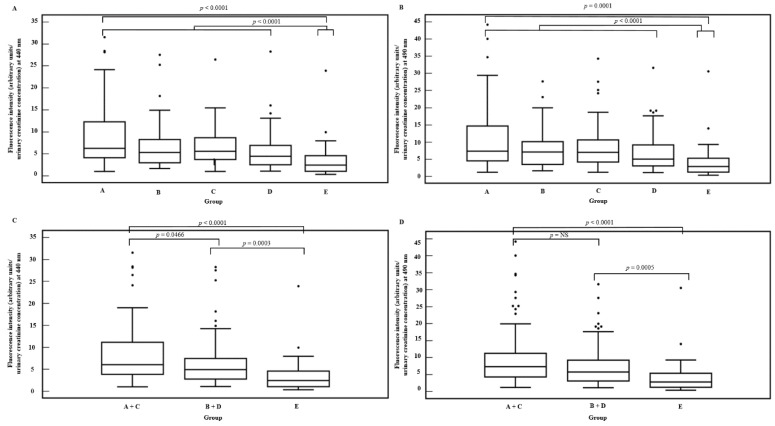
Figure 2.
Creatinine adjusted fluorescence intensities at 440 nm (A) and 490 nm (B) for the group of chronic kidney disease (CKD) patients (group A: CKD patients with diabetes mellitus and proteinuria, group B: CKD patients with diabetes mellitus and without proteinuria, group C: CKD patients with proteinuria and without diabetes mellitus, group D: CKD patients without diabetes mellitus and without proteinuria) and healthy subjects (group E). Creatinine adjusted fluorescence intensities at 440 nm (C) and 490 nm (D) in CKD patients with proteinuria (group A + C), in CKD patients without proteinuria (group B + D) and in healthy subjects (group E).

