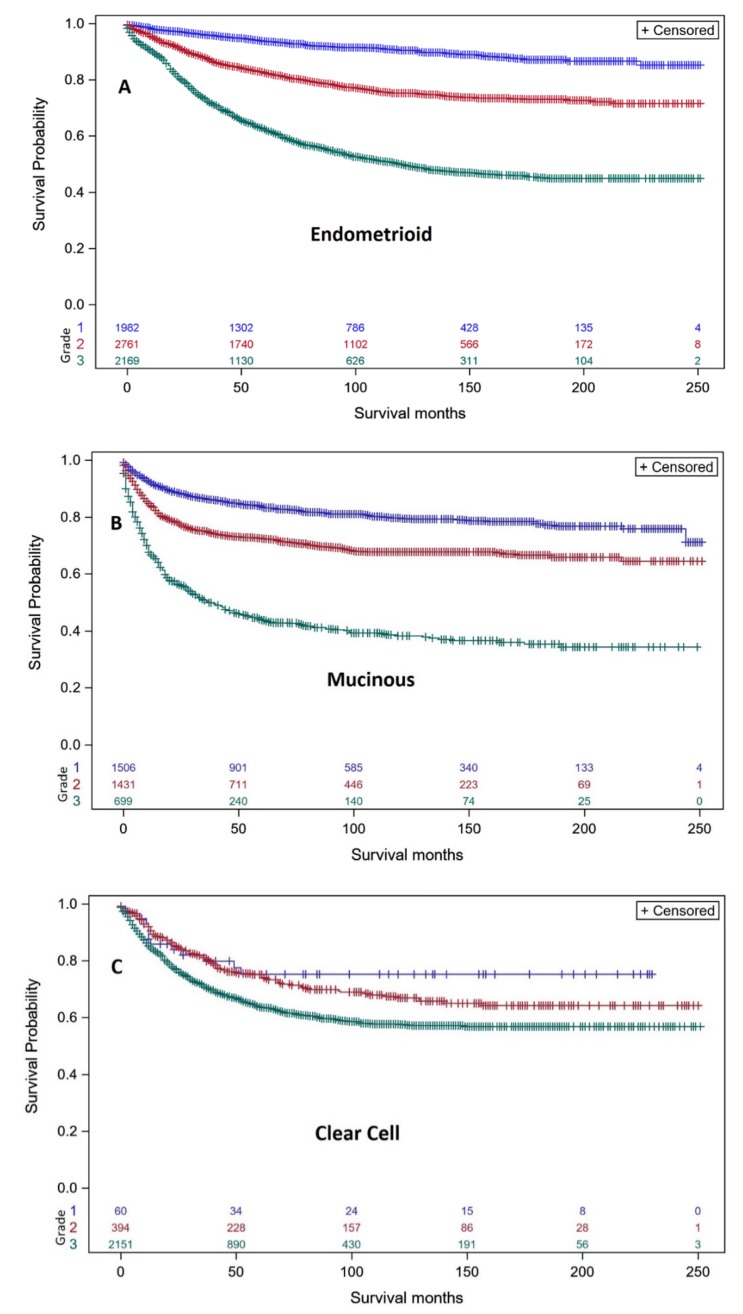
Figure 2.
Kaplan–Meier ovarian cancer-specific survival showing number of women at risk according to grade of endometrioid EOC, mucinous carcinoma and clear cell EOC. (A). Women with endometrioid EOC (8380/3) that was grade 1 well differentiated (blue curve, n = 1982; 50, 100 & 200-month survival is 94.8%, 91.4%, 86.5%), grade 2 moderately differentiated (red curve, n = 2761; 50, 100 & 200-month survival is 84.3%, 77.1%, 71.7%), and grade 3 undifferentiated (green curve, n = 2169; 50, 100 & 200-month survival is 66.4%, 52.9%, 44.4%). Log-rank test p < 0.001. (B). Women with mucinous EOC (8470/3, 8471/3, 8480/3, 8481/3, 8482/3) that was grade 1 well differentiated (blue curve, n = 1506; 50, 100 & 200-month survival is 84.5%, 80.7%, 76.4%, grade 2 moderately differentiated (red curve, n = 1431; 50, 100 & 200-month survival is 72.1%, 67.7%, 65.8%), and grade 3 undifferentiated (green curve, n = 699; 50, 100 & 200-month survival is 46.5%, 39.7%, 35.2%). Log-rank test p < 0.001. (C). Women with clear cell EOC (8310/3) that was grade 1 well differentiated (blue curve, n = 60; 50, 100 & 200-month survival is 77.4%, 74.7%, 74.7%), grade 2 moderately differentiated (red curve, n = 394; 50, 100 & 200-month survival is 76.2%, 69.0%, 63.3%), and grade 3 undifferentiated (green curve, n = 2151; 50, 100 & 200-month survival is 67.1%, 58.6%, 56.3%). The number of women remaining at different survival points is shown for well differentiated screened (blue), moderately differentiated (red), undifferentiated (green). Log-rank test p < 0.001.

