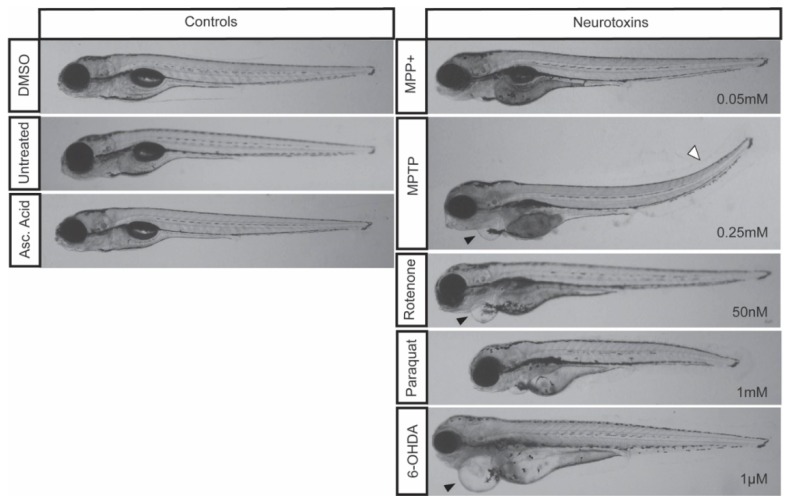
Figure 2.
Zebrafish morphology following neurotoxic exposures. Larvae were exposed to 0.05 mM MPP+, 0.25 mM MPTP, 50 nM rotenone, 1 mM paraquat, and 1µM 6-OHDA starting at 3 dpf and imaged at 7 dpf. Control larvae were exposed to 0.1% DMSO, 0.1% ascorbic acid, or left untreated. Cardiac defects are depicted by a black arrowhead and a tail curvature is depicted by a white arrowhead. Refer to Table 2 for the frequency of each morphological malformation.

