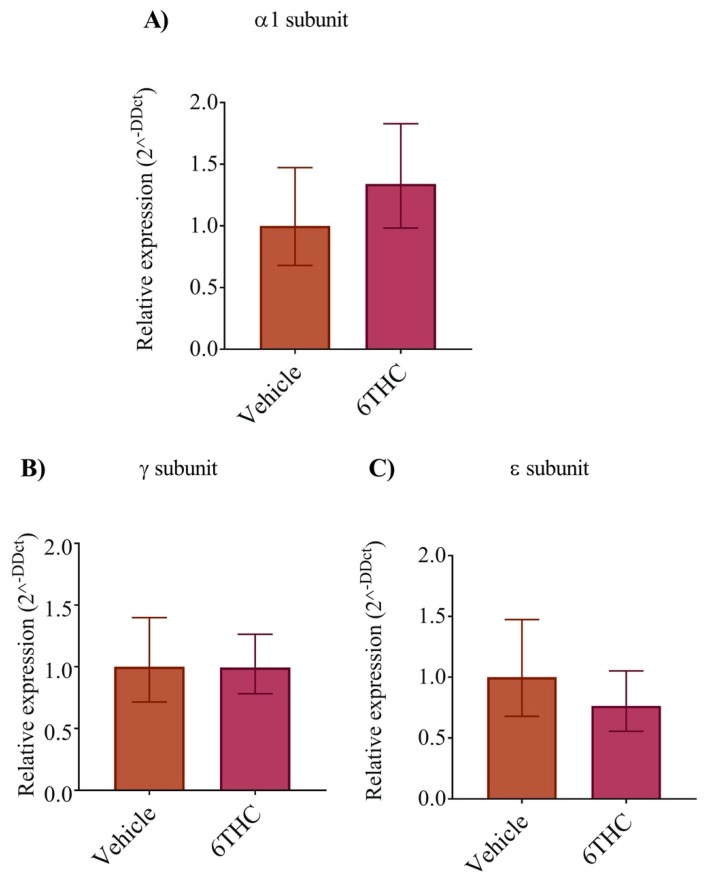
Figure 5.
The relative levels of nAChR subunits (α1, γ and ε) mRNAs were analyzed by real-time qPCR. The relative expression was measured from vehicle control and THC treated embryos using expression in vehicle control as calibrator. (A) The relative level of α1 nAChR expression from vehicle and THC treated embryos. (B,C) The relative expression of γ and ε, respectively. Data are expressed as the mean ± SE for individual groups (n = 5).

