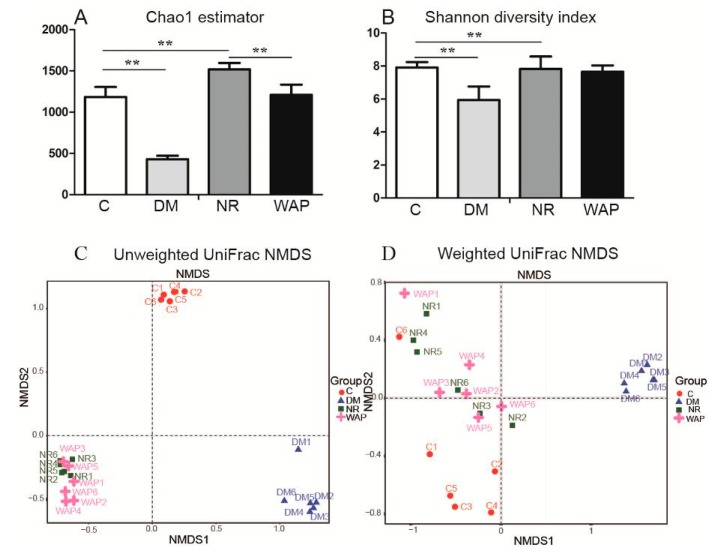
Figure 4.
α and β diversity analysis of the gut microbiota. (A) Chao1 estimator; (B) Shannon diversity index; (C) unweighted UniFrac NMDS; (D) weighted UniFrac NMDS. C, control group; DM, antibiotic-associated diarrhea group; NR, natural recovery group; and WAP, Astragalus polysaccharide group. Data are expressed as means ± S.D. (n = 6). ** p < 0.01.

