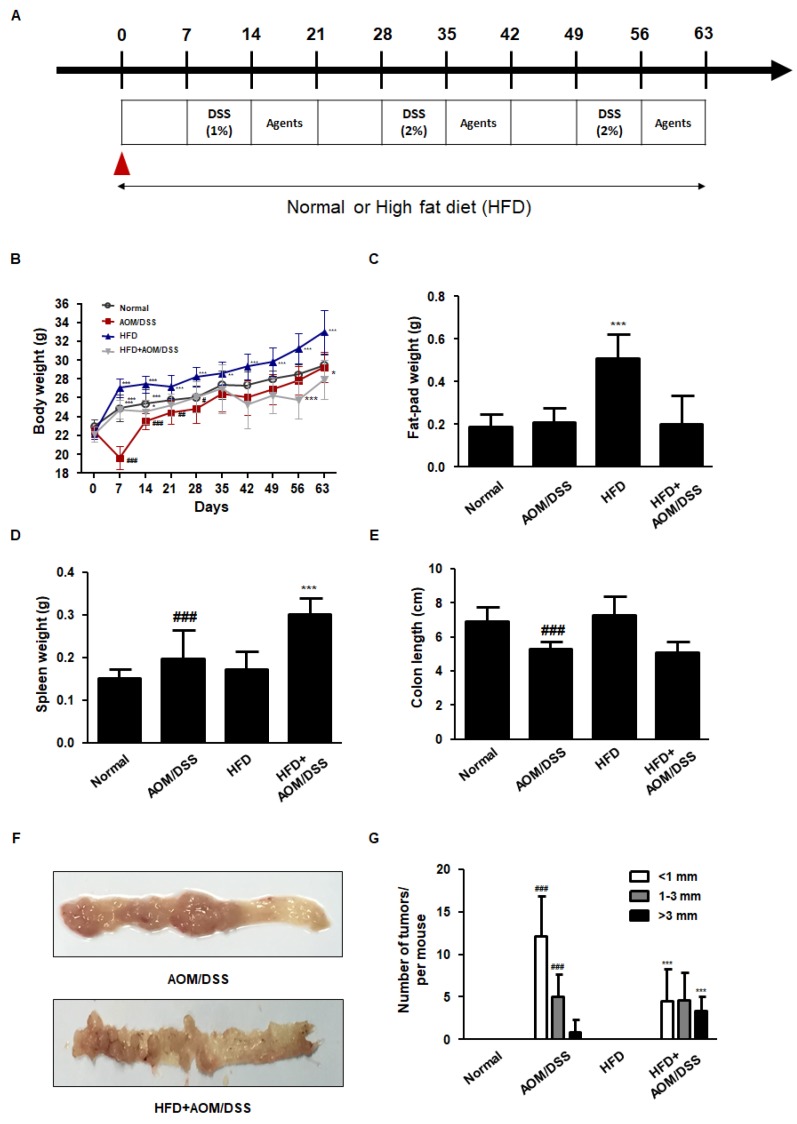
Figure 1.
Effects of HFD on the pathological symptoms in the AOM/DSS-induced CAC mice model. (A) Scheme of the AOM/DSS-induced CAC mice fed on normal diet or HFD. (B–G) The animals were randomly divided into four groups: normal group, AOM/DSS group (AOM/DSS-induced CAC mice), HFD group (mice fed HFD), and HFD+AOM/DSS group (AOM/DSS-induced CAC mice fed HFD). (B) Body weight, (C) fat-pad weight, (D) splenic weight, and (E) colon length were evaluated in each mouse. (F) Representative photograph of the colon tissues from the AOM/DSS and HFD+ AOM/DSS groups is shown. (G) The number of tumors in each group was measured. The values are the mean ± SD (n = 10); ### p < 0.001 vs. normal group; * p < 0.05, *** p < 0.001 vs. AOM/DSS group; significant differences between the treated groups were determined by ANOVA and Dunnett’s post-hoc test.

