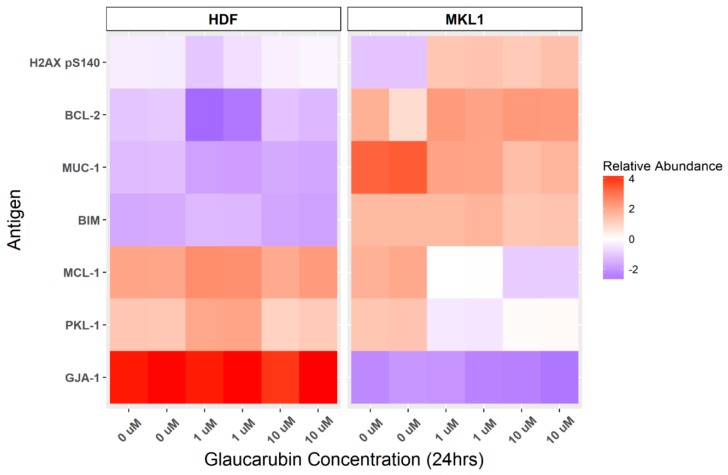
Figure 3.
Protein array identification of glaucarubin-affected genes. HDFs and MKL-1 cells were treated with DMSO or glaucarubin at the indicated concentrations. Duplicate cell lysates were harvested at 24 h post-treatment for each condition and subjected to RPPA analysis. The linear signal of each slide was normalized to actin for that same sample. Antigens that had a linear expression level greater than 2 for at least one of the conditions in MKL-1 cells were analyzed. Antigens increased or decreased in abundance after glaucarubin treatment were ranked in order of their greatest abundance change relative to that in HDFs. The six antigens with the greatest increase or decrease are pictured in the heat map. Heat map relative abundance scores are a visualization of actin-normalized, Log 2, median-centered signal for each sample. MUC-1, Mucin 1; BIM, Bcl-2-like protein 11, PKL-1, polo-like kinase 1; GJA-1, Gap junction alpha-1 protein.

