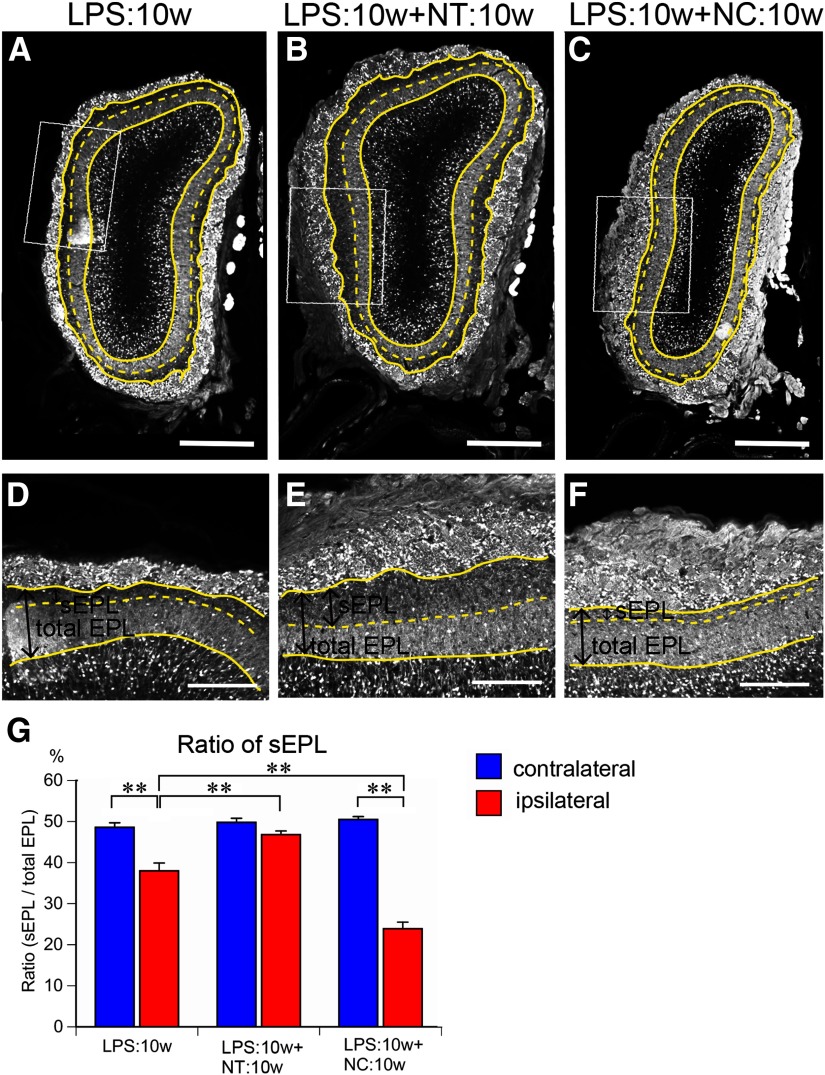
Figure 12.
Recovery of sEPL in the presence or absence of odor input. A–F, Coronal sections of ipsilateral OBs stained for calretinin. Solid yellow lines represent the borders of GL and EPL or EPL and MCL. Dotted yellow lines represent the borders of sEPL and dEPL. D–F, Magnified views of EPL indicated by rectangles in A–C. The sEPL area shrank in LPS:10w (A) and recovered in the presence (B) but not in the absence (C) of odor input. Scale bars: 500 μm (A–C) and 200 μm (D–F). G, Graph presents the ratios of sEPL to total EPL. The ratios of sEPL to total EPL significantly decreased in ipsilateral EPL in LPS:10w and LPS:10w+NC:10w, but not in the LPS:10w+NT:10w; **p < 0.01.

