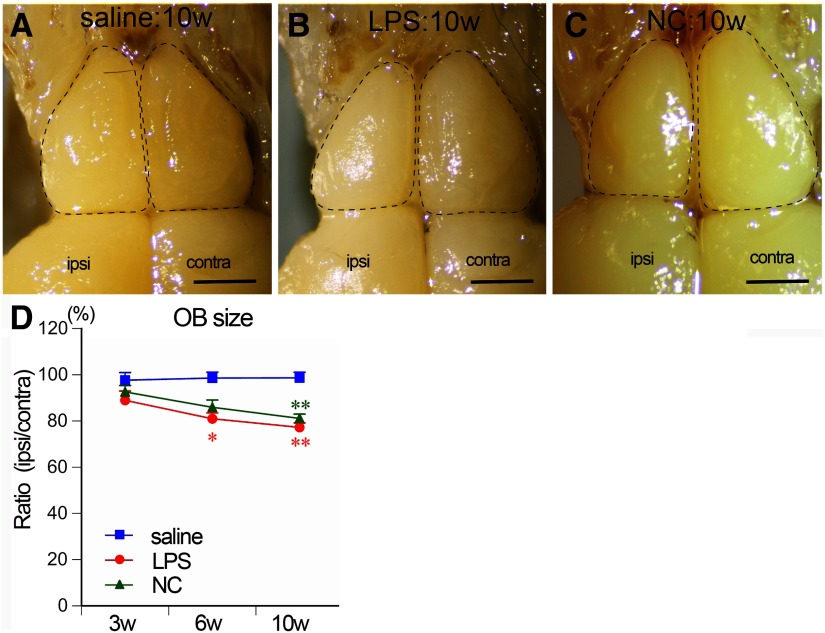
Figure 2.
Atrophy of the OB. A–C, Dorsal views of the OBs of saline:10w (A), LPS:10w (B), and NC:10w (C). Ipsilateral OBs atrophied in LPS:10w (B) and NC:10w (C). Scale bars: 1 mm. D, Graph presents the time course of changes in the OB size. Ratios of ipsilateral OB areas to the contralateral ones gradually decreased in LPS:10w and NC:10w; *p < 0.05, **p < 0.01 versus saline:10w.

