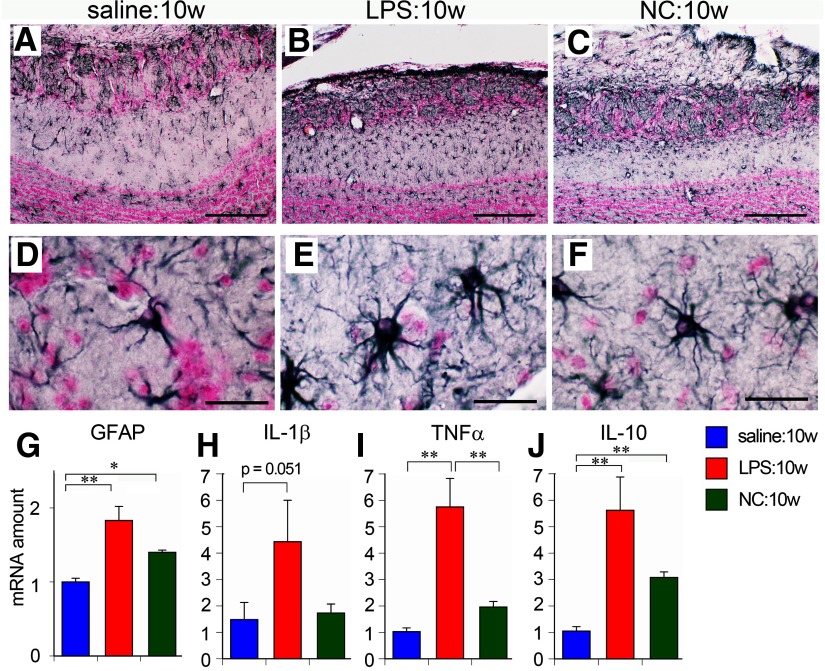
Figure 7.
Astrocytic hypertrophy and neuroinflammation in the OB. A–F, Immunohistochemistry for GFAP in ipsilateral OBs. Astrocytes were hypertrophic in LPS:10w (B, E) but not prominently in NC:10w (C, F) compared with those in the saline:10w (A, D). Representative astrocytes are magnified in D–F. Nuclei were stained for nuclear fast red. Scale bars: 200 μm (A–C) and 20 μm (D–F). G–J, Graphs present the relative amounts of transcript for GFAP, IL-1β, TNFα, and IL-10 in ipsilateral OBs. The transcript amounts of these molecules were significantly higher in the LPS:10w than in the saline:10w. The transcript amount of IL-10 was also higher in NC:10w than in saline:10w; *p < 0.05, **p < 0.01.

