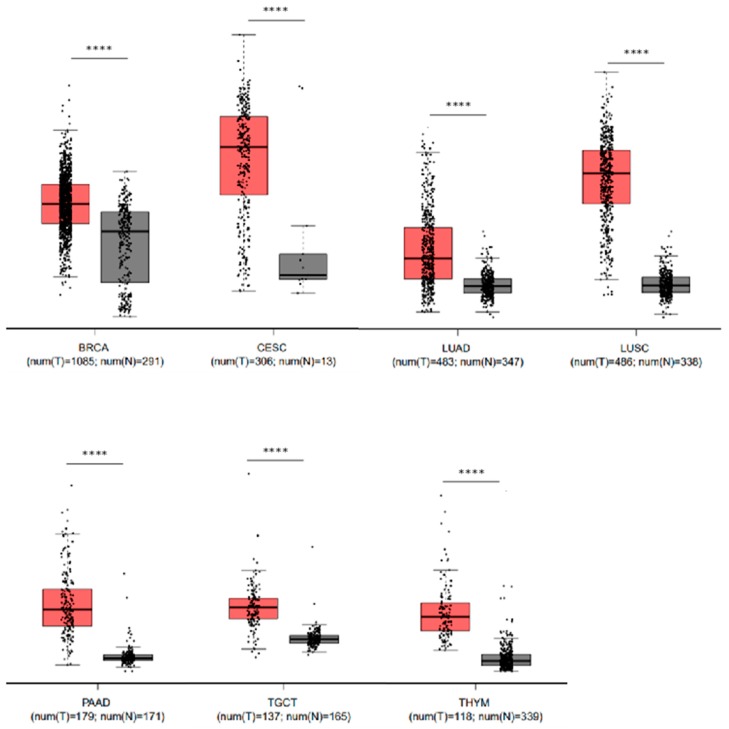
Figure 4.
LYPD3 mRNA expression is significantly (p < 0.001) upregulated in malignant cancer (T) versus the normal tissue (N) counterpart. Box and whisker plots illustrating the mRNA expression levels of LYPD3 in the following cancer versus normal tissue: BRCA—breast cancer, CESC—cervical squamous cell carcinoma and endocervical adenocarcinoma, LUAD—lung adenocarcinoma, LUSC—lung squamous cell carcinoma, PAAD—pancreatic adenocarcinoma, TGCT—testicular germ cell tumours and THYM—thymoma. Cancer are coloured red whilst normal are coloured grey. Each point represents an individual data point and the number of data points in each analysis is stated under the x-axis. The log2 fold change cut-off is 1 and differential analysis is by one-way ANOVA, using disease state as the variable for calculating differential expression.

