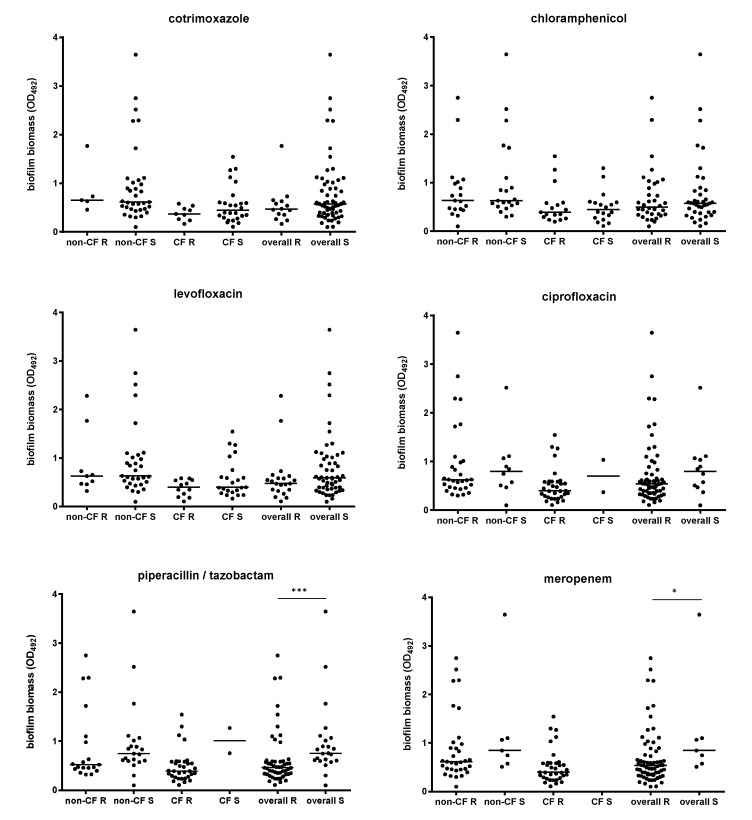
Figure 4.
Biofilm formation according to antibiotic resistance and patient type. Biofilm biomass formation, spectrophotometrically assessed by crystal violet assay, was stratified on each antibiotic tested—according to susceptibility (S) or resistance (R)—and patient type. Results are shown as scatter plots, with horizontal lines indicating the median values. Significance level at Mann–Whitney test: * p < 0.05; *** p < 0.0001.

