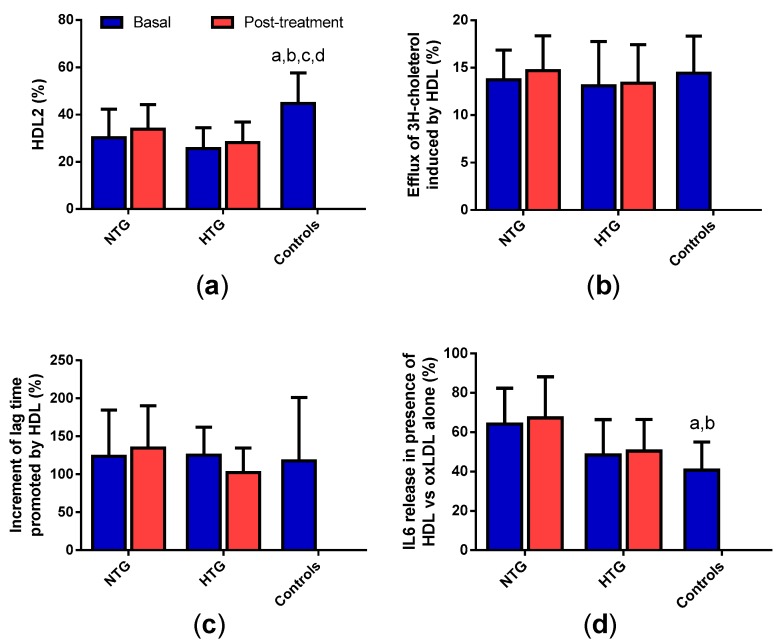
Figure 7.
Qualitative properties of HDL. (a) HDL2 (large HDL particles) proportion was determined by GGE and expressed as the proportion of total HDL; (b) proportion of 3H-cholesterol effluxed by HDL from cholesterol-loaded macrophages; (c) increment of the lag phase time of the oxidation kinetics of a standard LDL induced by CuSO4 in the presence of the HDL from each patient, expressed as percentage of lag time increase. (d) Proportion of IL-6 released from monocytes by oxidized LDL (oxLDL) in presence of HDL, compared with monocytes incubated with oxLDL alone (100% of IL-6 release). Data are expressed as mean ± SD. * p < 0.05 vs. basal samples. a p < 0.05 vs. basal NTG. b p < 0.05 vs. NTG post-treatment. c p < 0.05 vs. basal HTG. d p < 0.05 vs. HTG post-treatment.

