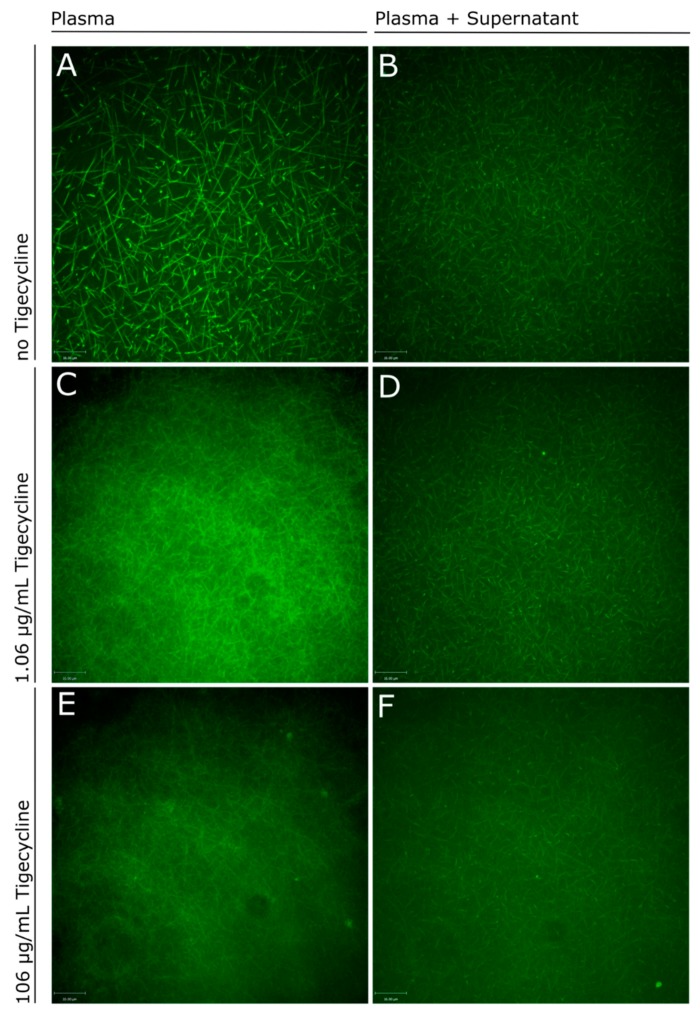
Figure 2.
Confocal imaging of fibrin networks in plasma (left panel side) and plasma exchange experiments (right panel side). (A) shows the fibrin network in platelet-free plasma (PFP) of a healthy donor and (B) mixed with the supernatant of HepG2 cell culture experiments without the addition of tigecycline. Fibrin polymerization was compared to experiments applying increasing doses of tigecycline: PFP mixed with 1.06 µg/mL (C) and 106 µg/mL tigecycline (E) versus PFP mixed with conditioned supernatant of HepG2 after 24 h incubation in a 1:1 ratio with 1.06 µg/mL (D) and 106 µg/mL tigecycline (F). green = Fluorescein isothiocyanate (FITC)-labeled FXIIIa; PFP = platelet free plasma.

