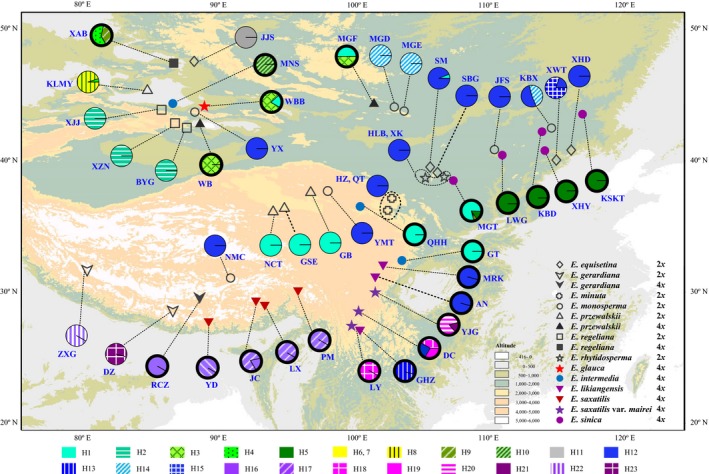
Figure 1.

Sampling locations and distribution frequencies of the cpDNA haplotypes detected in the studied 12 Ephedra species. Thick and thin outlines of the pie charts indicate tetraploids and diploids, respectively. Population names correspond to those in Table 1.
