Figure 7.

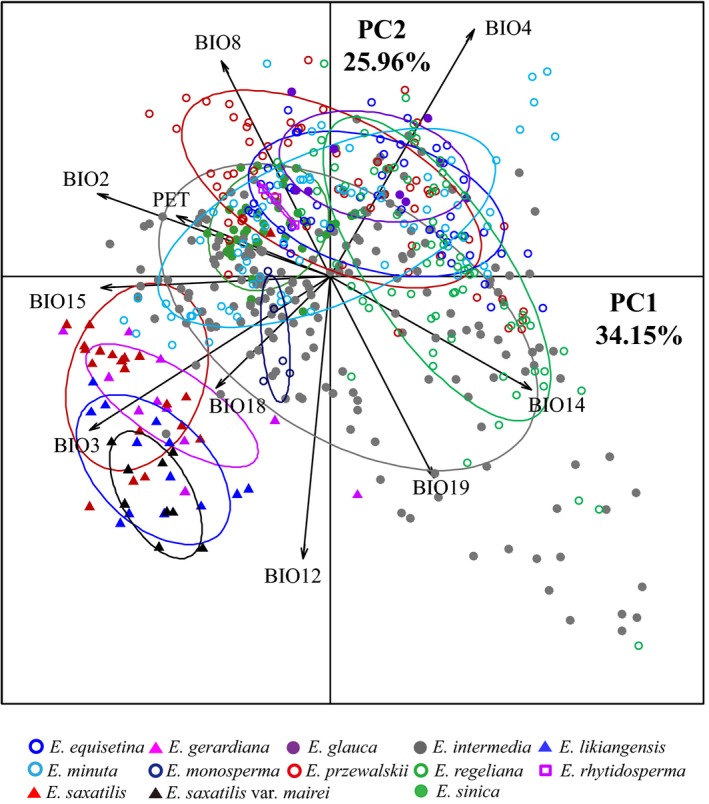
Scatter plots of PC1 and PC2 showing ecological differentiation among the studied Ephedra species based on 10 bioclim variables at sampling locations.

Scatter plots of PC1 and PC2 showing ecological differentiation among the studied Ephedra species based on 10 bioclim variables at sampling locations.