Figure 3.

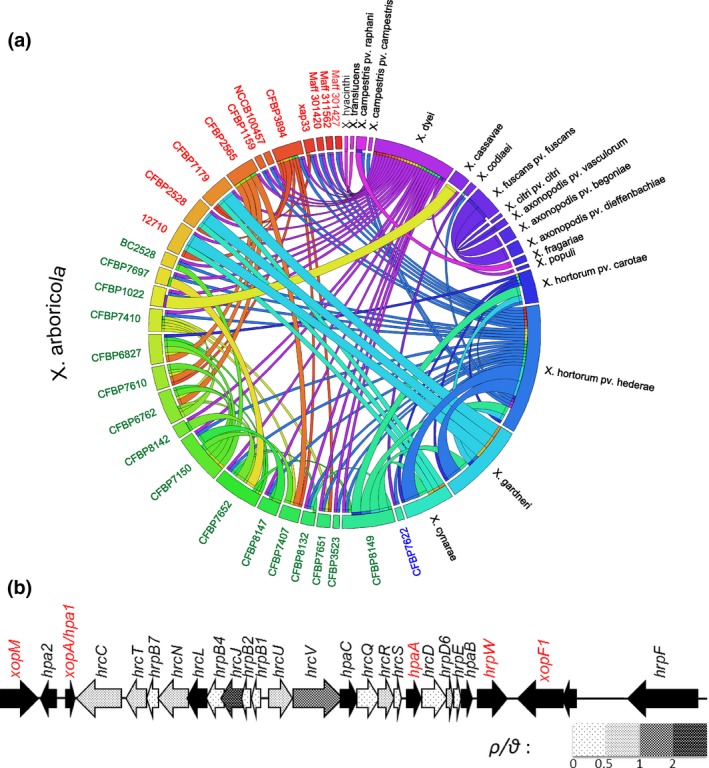
Gene flow affecting the T3SS cluster. (a) Representation of recombination events affecting 16 hrc/hrp genes of the T3SS cluster in Xanthomonas genus. The donor and recipient strains were identified with rdp software, and the representation was obtained using Circos. Each strain is represented by a rectangle of a different colour. The recombination events are represented by a link between donor and recipient strains. The colour of the link corresponds to the colour of the donor and indicates the direction of recombination event. The width of the links represents the number of genes involved in the recombination events. For strains belonging to Xanthomonas arboricola a colour code was used to represent the three groups previously defined (Merda et al., 2016). Group A strains are indicated in red, group B strains in green, and group C strains in blue. (b) Representation of ratios of recombination rate vs. mutation rate (ρ/θ) along the T3SS cluster using 61 genomes representing the genus diversity. Ratios were calculated for the 16 hrc/hrp genes of the core region of T3SS cluster using rdp software. Arrows are shaded according to the shading scale which indicates the range of the ρ/θ value. The black arrows represent hpa and T3E genes for which ρ/θ was not calculated. Genetic organization of the cluster is based on the sequence of CFBP 2528. In red are represented the five core T3E genes located in the T3SS cluster of X. arboricola strains [Colour figure can be viewed at http://wileyonlinelibrary.com]
