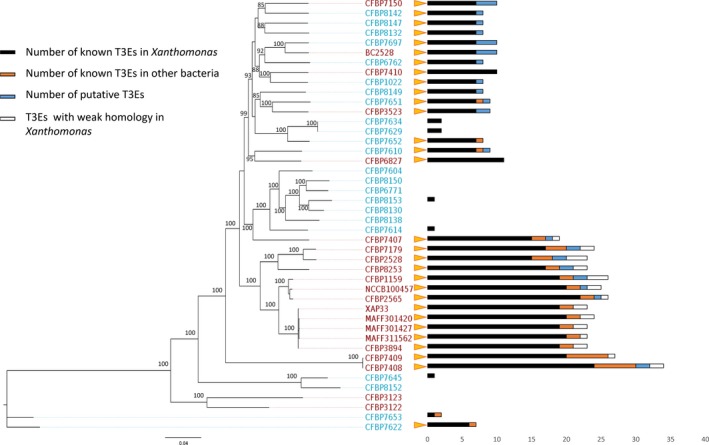
Figure 4.

Representation of T3E repertoires in Xanthomonas arboricola strains. The phylogeny was performed in maximum likelihood using the concatenated sequences of 1705 CDS composing the core genome of these 44 strains. Bootstrap values (100 bootstraps) higher than 85% are indicated at each node. Pathogenic strains are represented in red and commensal ones in blue. At the tip of each branch, the orange triangles represent the presence of T3SS cluster and bars represent the composition of the T3E repertoire according to the legend [Colour figure can be viewed at http://wileyonlinelibrary.com]
