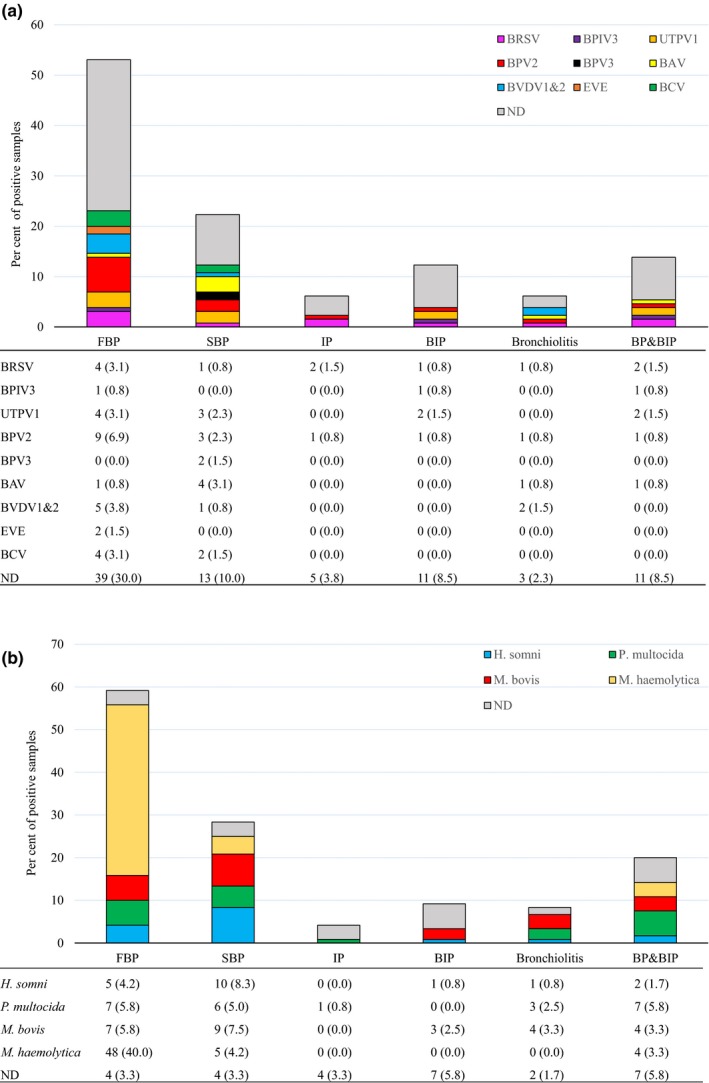
Figure 3.

(a) The prevalence of identified viruses in each type of pneumonia (n = 130). The bar charts show the proportion of virus positive and ND samples assigned to each type of pneumonia by colour as illustrated in the legend. The lower table shows the number (per cent) of virus positive and ND samples out of 130 total samples. BAV, bovine astrovirus; BCV, bovine coronavirus; BPIV3, bovine parainfluenza virus 3; BPV 2 and 3, bovine parvovirus 2 and 3; BRSV, bovine respiratory syncytial virus; BVDV 1 and 2, bovine viral diarrhoea virus 1 and 2; EVE, Enterovirus E; ND, viruses not detected; UTPV1, ungulate tetraparvovirus 1. Only viruses identified in at least two samples are shown. (b) The prevalence of bacteria in each type of pneumonia (n = 120). The bar charts show the proportion of bacteria positive and ND samples assigned to each type of pneumonia by colour as illustrated in the legend. The lower table shows the number (per cent) of bacteria positive and ND samples out of the total cultured. H. somni, Histophilus somni; M. bovis, Mycoplasma bovis; M. haemolytica, Mannheimia haemolytica; ND, bacteria not detected; P. multocida, Pasteurella multocida
