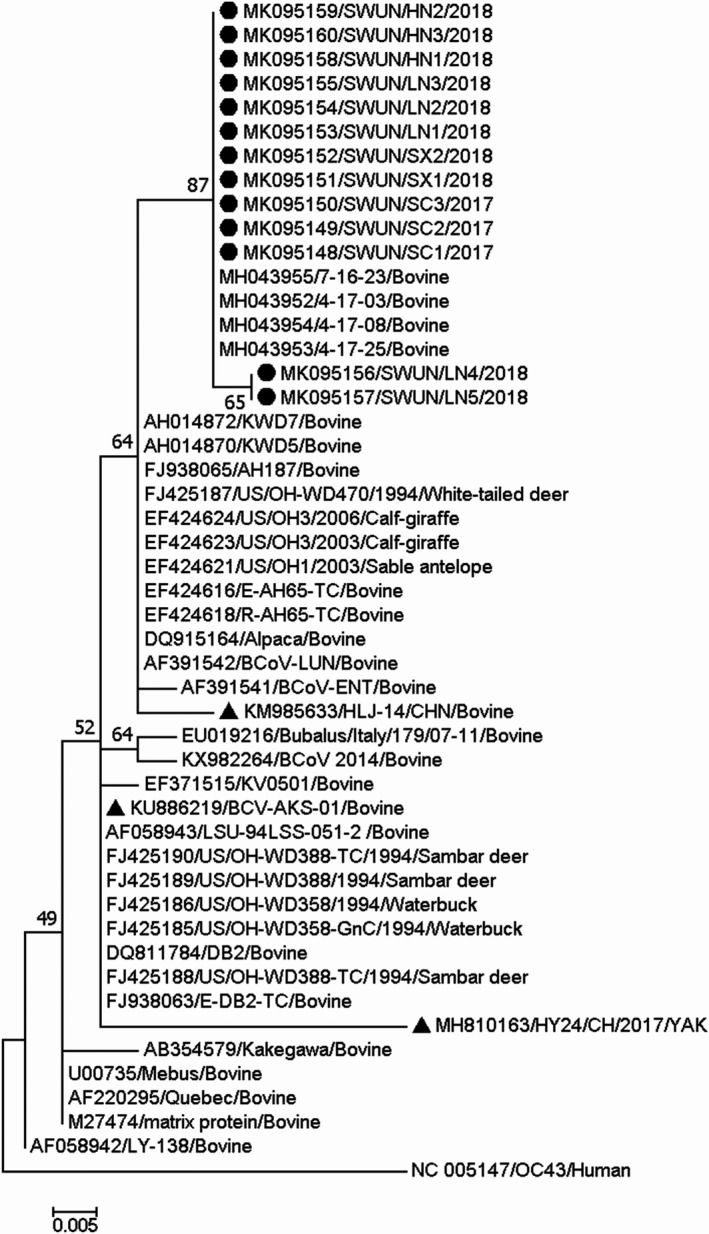
Figure 7.

Phylogenetic tree based on the deduced 230 aa sequences of the complete M gene. Sequence alignments and clustering were performed by ClustalW in MEGA 7.0 software. The tree was constructed by the maximum‐likelihood method with bootstrap values calculated for 1,000 replicates. The strains in this study were marked with a circle, and the other Chinese BCoV strains were marked with a triangle
