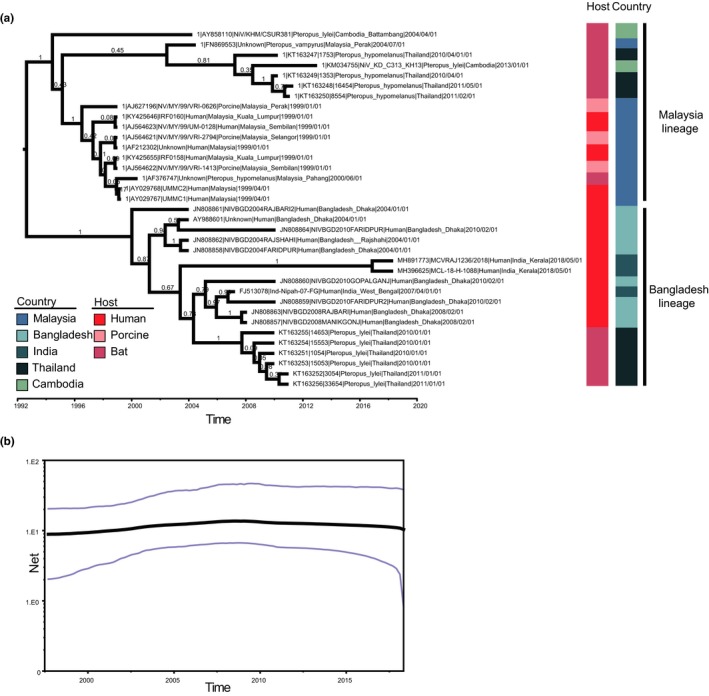
Figure 2.

Maximum clade credibility (MCC) tree and skygrid plot based on the N gene. (a) The MCC tree was reconstructed using BEAST (version 1.8.4). The GTR + G distribution model and the coalescent: Bayesian skygrid model with a total chain length of 1 × 10⁹ and sampled every 1 × 10⁴ times. Host and country of NiV isolates are indicated with inner and outer coloured rectangular boxes, respectively. (b) Skygrid plot of NiV. The grey line is the mean value while the blue line is 95% HPD [Colour figure can be viewed at http://www.wileyonlinelibrary.com/]
