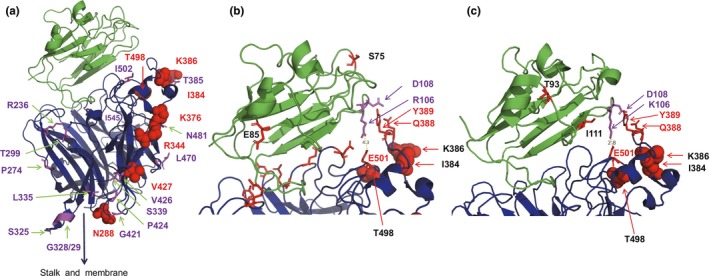
Figure 3.

(a) Structure of the ectodomain of the NiV G protein (blue) bound to the ephrin‐B3 receptor (green). Adaptive amino acids are shown as red spheres. Amino acid differences between viruses of the two lineages are depicted as magenta sticks. (b) Receptor‐binding site of G (blue) bound to ephrin‐B3 (green). Amino acids in G forming salt bridges and hydrogen bonds with mouse ephrin‐B3 are shown as red sticks. E501 forms a salt bridge with R106 and Q388 and Y389 form hydrogen bonds with D108. Adaptive amino acids are shown as red spheres. The amino acids which are different in bat ephrin‐B3 (S75, E85) are labelled as red sticks in the ephrin structure. 4.3 indicates the distance between E501 and R106 in Angstrom. (c) Receptor‐binding site of G (blue) bound to ephrin‐B2 (green). E501 forms a salt bridge with K106 and Q388 and Y389 form hydrogen bonds with D108. Adaptive amino acids are shown as red spheres. The amino acids which are different in bat ephrin‐B2 (T93, I111) are labelled as red sticks in the ephrin structure. In addition, K106 is exchanged in bat ephrin‐B2 by an R and thus to the same amino acid present in ephrin‐B3. 2.8 indicates the distance between E501 and K106 in Angstromss [Colour figure can be viewed at http://www.wileyonlinelibrary.com/]
