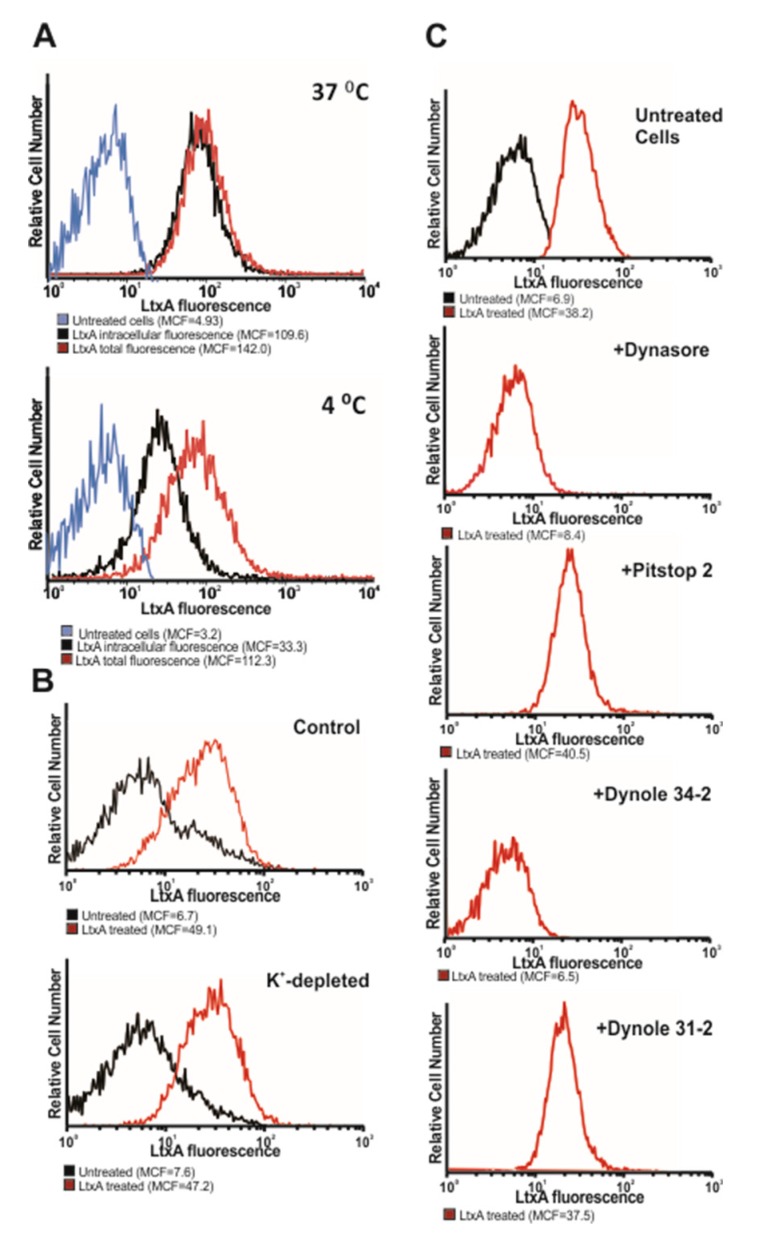
Figure 2.
Effect of endocytosis inhibitors on LtxA internalization. (A). Flow cytometry analysis of LtxA internalization with Jn.9 cells at different temperatures. The cells were treated with LtxA-DY488 for 30 min on ice or 37 °C. In a set of cells, the total cell-associated fluorescence was measured by flow cytometry analysis (shown in red). In another set of cells, the extracellular fluorescence was quenched (0.025% trypan blue) [42] and intracellular fluorescence (red peak) was determined by flow cytometry analysis. (B). Flow cytometry analysis of LtxA internalization with Jn.9 cells in K+-free buffer. Jn.9 cells (1 × 10⁶) were incubated in K+-containing (top) or K+-free buffer (bottom), and then 20 nM LtxA-DY488 was added for 30 min. Flow cytometry analysis to determine the amount of internalized toxin (red peak) was performed as described in Figure 2A. (C). Flow cytometry analysis of LtxA-DY488 internalization with Jn.9 cells pretreated with chemical inhibitors. Jn.9 cells (1 × 10⁶) were preincubated with 5–10 µM endocytosis inhibitors for 20 min in serum free medium, and then were treated with 20 nM LtxA-DY488 for 30 min at 37 °C. The extracellular fluorescence was quenched 0.025% trypan blue, and intracellular fluorescence (red peak) was determined by flow cytometry analysis.

