Figure 4.
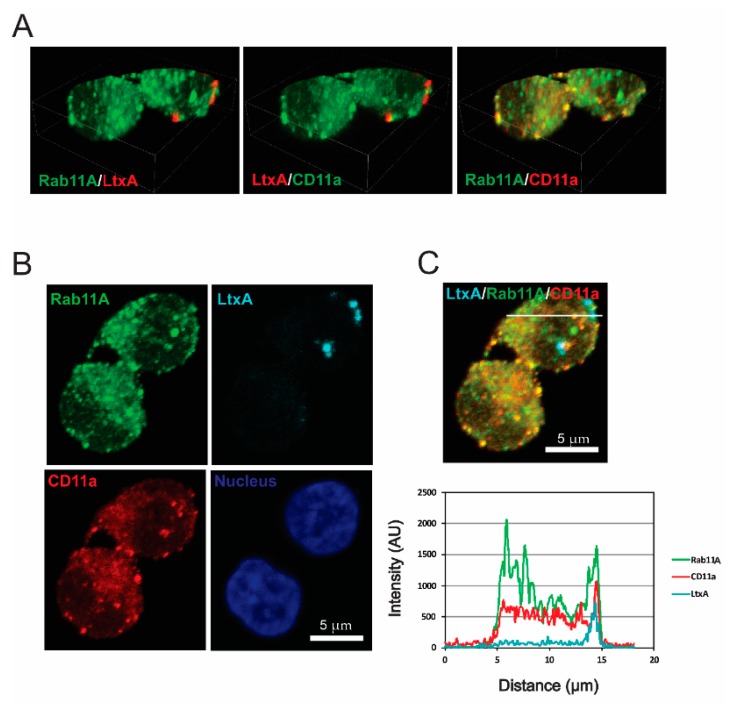
LtxA localization in Rab11A-positive endosomes of Jn.9 cells. The cells were treated with 20 nM LtxA for 30 min at 37 °C. (A). 3D confocal images showing the distribution of LtxA, CD11a and Rab11A. LtxA is pseudo colored in red and CD11a is in red or green (pseudo colored), as indicated on images. The 3D images were reconstructed from seventeen confocal planes using Nikon Elements AR 4.30.01 software. Bounding box dimensions are: width 22.58 µm; height 16.47 µm; depth 5.20 µm. (B). Localization of LtxA-DY650 is shown in cyan, CD11a recognized with mouse Alexa Fluor™ 594 clone HI111 is shown in red, and Rab11A, recognized by rabbit anti-Rab11A antibody followed by staining with anti-rabbit IgG Alexa Fluor®488, is shown in green. The nucleus was stained with Hoechst dye and is shown in blue. (C). Top: Merged image “B” showing co-localization of LtxA DY650 (cyan), CD11a (red) and Rab11A (green). Bottom: Intensity profiles for LtxADY650 (cyan), CD11a (red) and Rab11A (green) across the line depicted in the image above. The degree of overlap in the LtxA-containing area was estimated with the Pearson’s correlation coefficient of 0.75 for LtxA and Rab11A, 0.72 for LtxA and CD11a, and of 0.76 for CD11a and Rab11A. Representative cells are shown. Additional data are shown in Figure S6.

