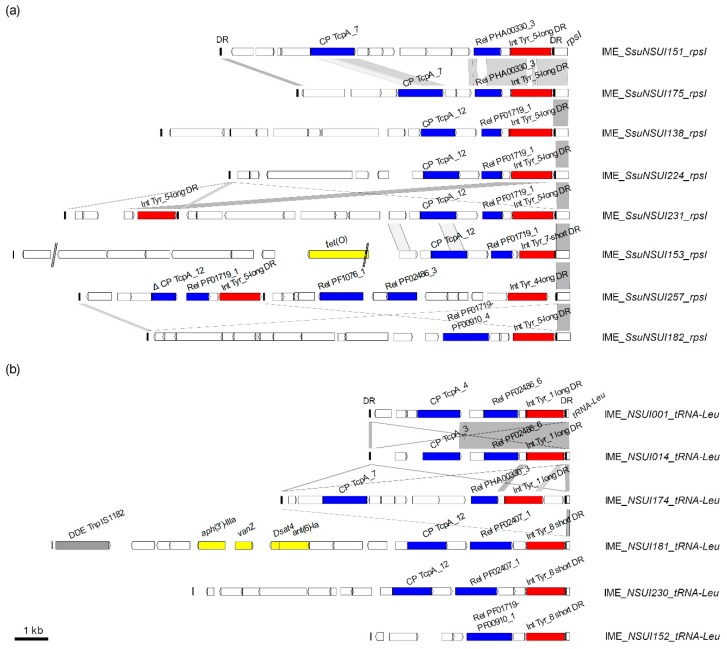
Figure 6.
Comparison of integrative and mobilizable elements (IMEs) integrated (a) into rpsI and (b) into a tRNALeu gene in S. suis. IMEs are named according to their host strains and integration sites. Direct repeats are indicated as black vertical rectangles. Coding DNA sequences (CDSs) appear as arrows (truncated genes are indicated by deltas). The integrase genes appear in red. The relaxase and coupling protein genes appear in blue. The different integration genes (rpsI and tRNALeu gene) targeted by the integrase are indicated in the figure and are part of the IME name. Genes encoding proteins with putative function inferred from in silico analysis are indicated (in yellow for antimicrobial resistance genes and in gray for transposase genes). Nucleic acid sequence identity between sequences is indicated in light gray when >80% of identity and in dark gray when higher than 90% of identity. Gaps in the assembly are indicated by a double slash.

