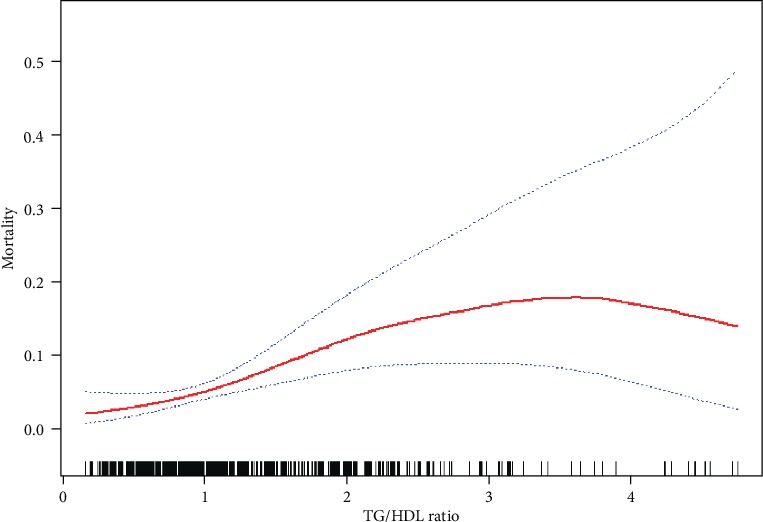
Figure 3.

Association between TG/HDL-c ratio and in-hospital mortality. A nonlinear association between TG/HDL-c ratio and in-hospital mortality was found. The solid red line represents the smooth curve fit between variables. Blue bands represent the 95% confidence interval from the fit. All adjusted for gender, age, BMI, hypertension, smoking, atherosclerosis, WBC, PLT, Hb, ALT, AST, Cr, UA, and TnT.
