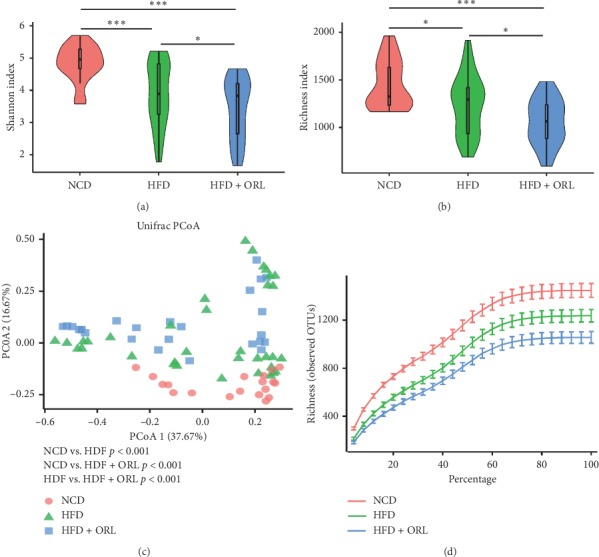
Figure 2.

Effects of orlistat on gut microbial composition in HFD-induced obese mice. Pairwise comparisons of α diversity, including (a) Shannon index and (b) Richness index, were detected among the NCD, HFD, and HFD + ORL group (blue squares). (c) Analysis of β diversity by principal coordinates analysis (PCoA) of weighted Unifrac distances in NCD (dots in orange), HFD (green triangles), and obese mice with orlistat supplementation (blue squares). (d) Rarefaction curves according to species richness (observed OTUs) in three groups. As the curves tend to be flat, enough extracted sequences were detected.
