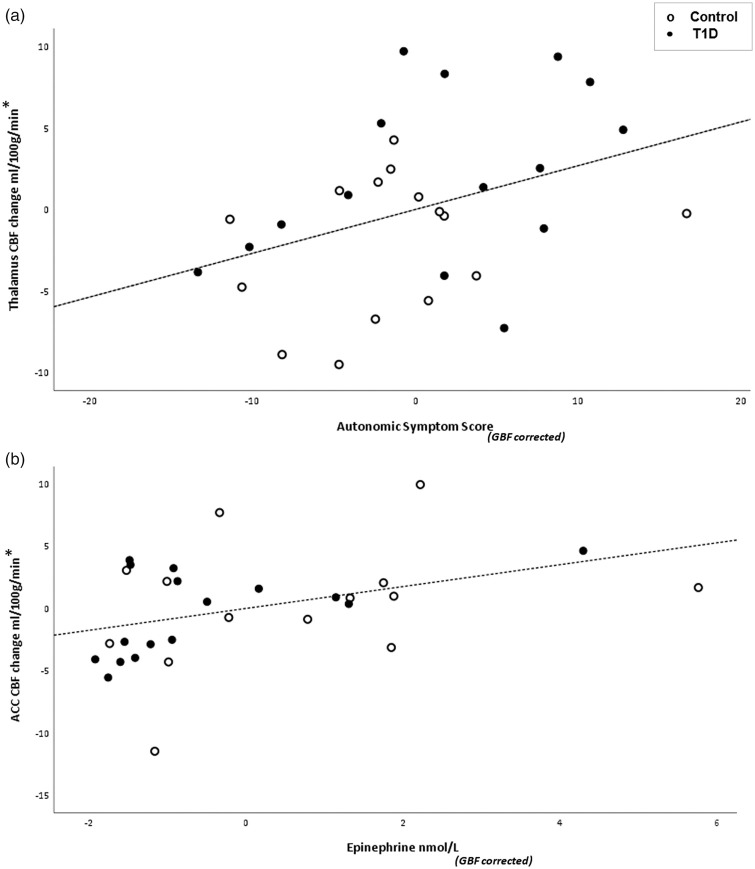
Figure 4.
(a) Correlation between mean thalamic CBF change and mean autonomic symptom score difference between euglycemia and hypoglycemia across groups, GBF as covariate (*GBF corrected) R = 0.381, p = 0.041, degrees of freedom (df) = 27. (b) Correlation between mean ACC CBF change and mean epinephrine difference between euglycemia and hypoglycemia across groups, GBF as covariate (*GBF corrected) R = 0.391, p = 0.036, df = 27. Non-diabetic controls shown in open circles and T1D shown in closed circles. T1D: type 1 diabetes; CBF: cerebral blood flow; GBF: global blood flow.

