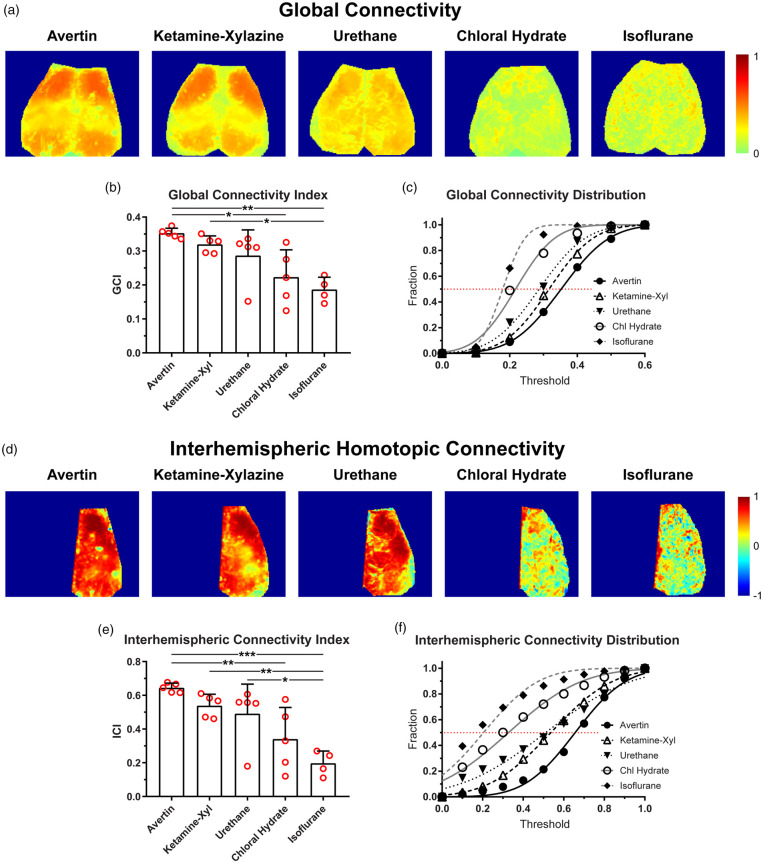
Figure 2.
Global and interhemispheric homotopic connectivity varies based on the anesthetic used. (a) Representative maps showing the mean correlation coefficient of each pixel to every other pixel within the map for Avertin, ketamine–xylazine, urethane, chloral hydrate, and isoflurane. Only positive correlations were used for the maps. (b) A global connectivity index (GCI) was calculated which took the means of all the pixels within the maps from (a) for each anesthetic. (c) The proportion of pixels below a threshold mean correlation coefficient is plotted and fitted with a Gaussian distribution. (d) Representative maps showing the correlation coefficient of a pixel in one hemisphere with its mirror pixel in contralateral hemisphere (i.e. its homotopic partner in contralateral hemisphere). (e) An interhemispheric connectivity index (ICI) was calculated which took the means of all the pixels within the maps from (d) for each anesthetic. (f) The proportion of pixels below a threshold mean correlation coefficient is plotted and fitted with a Gaussian distribution. *p < 0.05, **p < 0.01, ***p < 0.001, Bonferroni-corrected.

