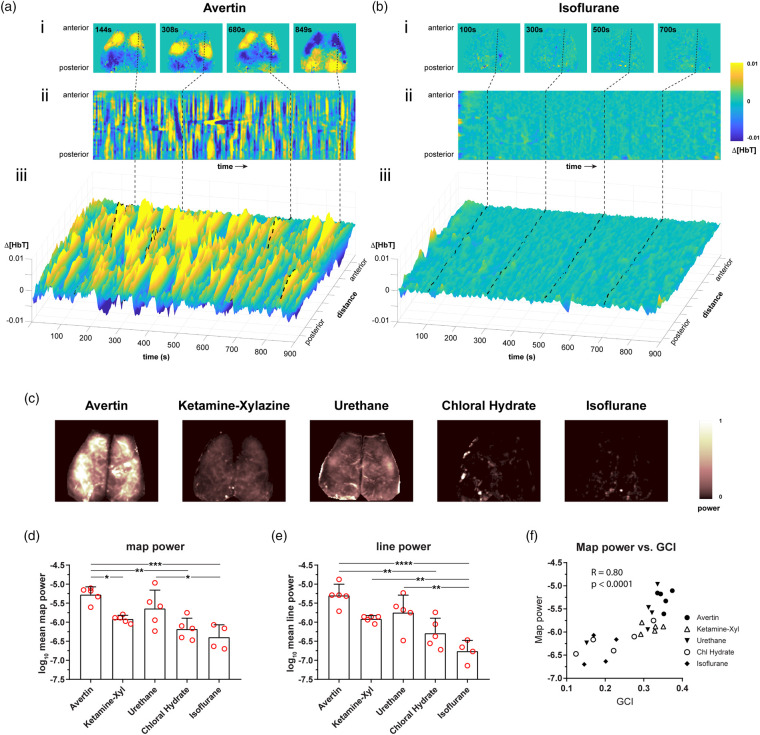
Figure 3.
Anesthetics have differential effects on the amplitude of the globally regressed, low-frequency hemodynamic signal. (a and b) Avertin and isoflurane were chosen as examples to demonstrate the differences in the spatiotemporal fluctuations in the hemodynamic signal. (i) Representative maps at different time points during an imaging session show relative common patterns of blood volume distribution across the dorsal surface of brain. (ii) A sagittal profile was drawn through the motor, somatosensory, and visual cortices (dashed line), and the hemodynamic signal across the line was plotted over of time. (iii) A three-dimensional representation of (ii) is shown to highlight regional changes in blood volume fluctuations and the difference in the hemodynamic signal between Avertin and isoflurane. (c) Representative power maps show the amplitude of the hemodynamic fluctuations used to derive functional connectivity for Avertin, ketamine–xylazine, urethane, chloral hydrate, and isoflurane. Power is normalized between 0 and 1 in the scale. (d) The average power for all pixels in the hemodynamic map for each anesthetic is shown. (e) The average power along the sagittal profile drawn over the hemodynamic map for each anesthetic is shown. (f) Power of the hemodynamic signal correlates with the GCI (global connectivity index) across anesthetics. R is the Pearson correlation coefficient. *p < 0.05, **p < 0.01, ***p < 0.001, ****p < 0.0001, Bonferroni-corrected.

