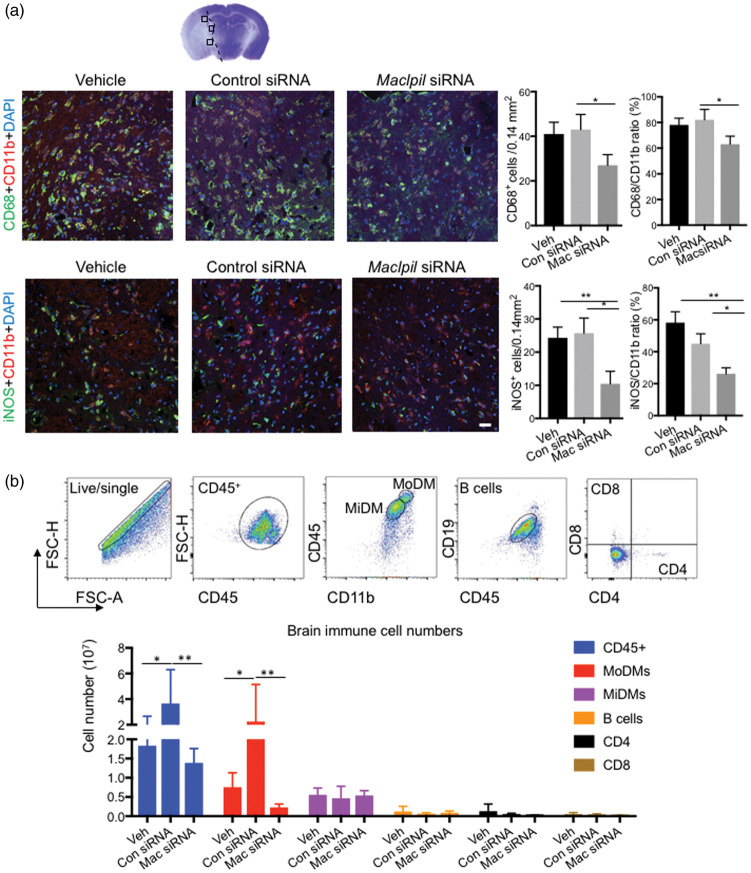
Figure 5.
The effects of MSM adoptive transfer on leukocyte accumulations in the ischemic brain. (a) Confocal immunofluorescent staining for CD11b, CD68, and iNOS, and counter stained with DAPI. The top panel shows a representative brain section stained with cresol/violet, on which three indicated regions are identified for cell number quantification. The middle panel shows the representative staining of CD11b+ (red) and CD68+ (green), and the bottom panel shows the representative staining of CD11b+(red) and iNOS+ (green) in vehicle, control siRNA, and MSM groups at 72 h after stroke. The bar graphs in the right show CD68+ and iNOS+ cell numbers and their percentages in total microglia/macrophage (CD11b+ cells). Scale bar: 20 μm. n = 5–6 mice/group. *, **p < 0.05, p < 0.01. (b) FACS analysis of the ischemic brain immune cells. The upper pictures show the representative gating methodology in the brain to identify MoDMs, MiDMs, B cells, CD4 and CD8 T cells. Bar graphs of the statistical results for each cell types. n = 5 mice/group, two-way ANOVA, * p < 0.05, **p < 0.01.

