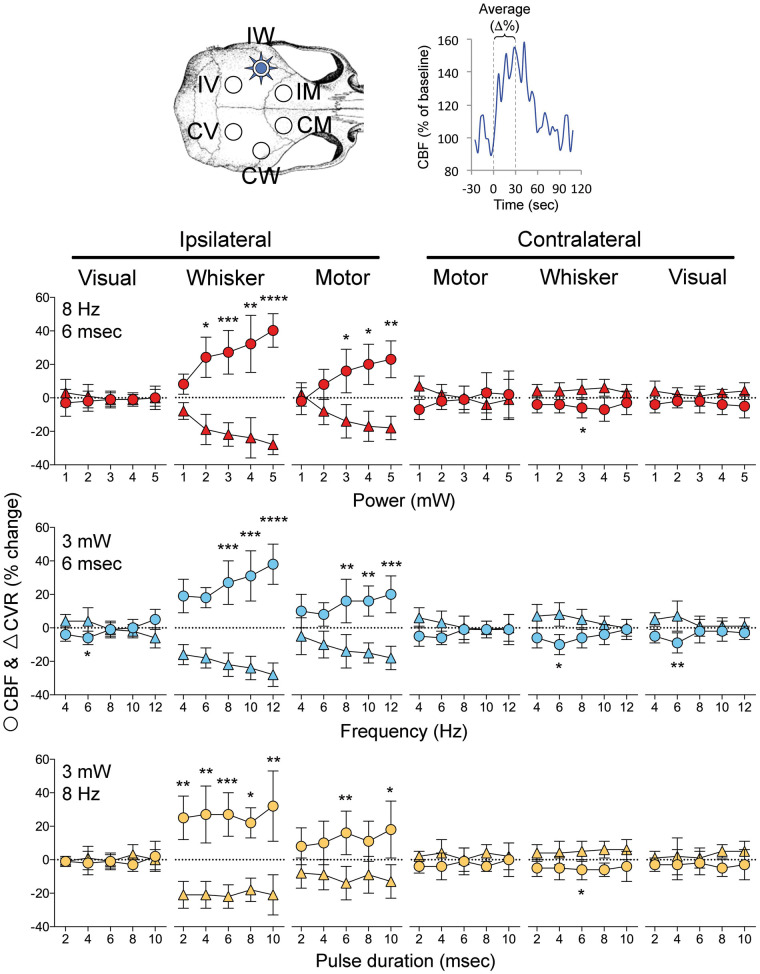
Figure 2.
Effect of pulse intensity, frequency and duration on optogenetic CBF responses. Changes in CBF (circles) and CVR (triangles) in six regions of interest (upper left) were quantified by averaging the 30-s stimulation period (as shown in upper right). Graphs show the relationship between power (1–5 mW; 8 Hz, 6 ms), pulse frequency (4–12 Hz; 3 mW, 6 ms) or pulse duration (2–10 ms; 3 mW, 8 Hz), and the CBF and CVR responses calculated as percent change from baseline (n = 8 mice). *p < 0.05, **p < 0.01, ***p < 0.001, ****p < 0.0001 vs. baseline. One-way ANOVA for repeated measures followed by Dunn's multiple comparisons.

